Tung Tung Tung Sahur Price Prediction: Can $TRIPLET Keep Rising?


A wild overnight run has traders asking one question again: Is Tung Tung Tung Sahur price prediction still worth watching after this jump, or did the move already happen? Turns out, the chart tells a more layered story than the green candle suggests.
Why Is TRIPLET Suddenly Everywhere Today
Tung Tung Tung Sahur price prediction is back in trader chats today, and it's easy to see why. The coin just ripped higher in a single session, catching even regular holders off guard.
Basically, this is the kind of move that turns a quiet meme token into one of the top memecoins traders check overnight. Price didn't creep up slowly. It jumped.
And when a token this small moves this fast, attention follows fast too. New wallets show up. Old holders start watching the chart again instead of ignoring it.
Here's the thing: sharp green candles like this one usually bring two crowds at once. One group chases the pump. The other waits for it to cool off.
So which crowd is right this time? That's the part worth sitting with for a minute.
A Quick Look At TRIPLET Coin Right Now
| Field | Detail |
|---|---|
| Coin Name | Tung Tung Tung Sahur |
| Ticker Symbol | TRIPLET |
| Blockchain | Solana |
| Today High | $0.02618 |
| Today Low | $0.01911 |
| RSI Level | 68.02 |
| Token Type | Meme Token |
| Token Category | Meme, Community Token |
| Market Cap | $19.36M |
| 24H Trading Volume | $2.93M |
| Circulating Supply | 999.93M TRIPLET |
| 24H Change | +58.3% |
Source: Data by CoinGecko
What Exactly Is This Meme Coin Everyone Is Talking About
Tung Tung Tung Sahur runs on Solana and started as a pure internet meme token, no big roadmap attached. It launched through Pump.fun a little over four months ago.
People care about it because the name itself became a viral joke first. The coin just rode that wave onto the chain.
Why TRIPLET Price Action Suddenly Matters
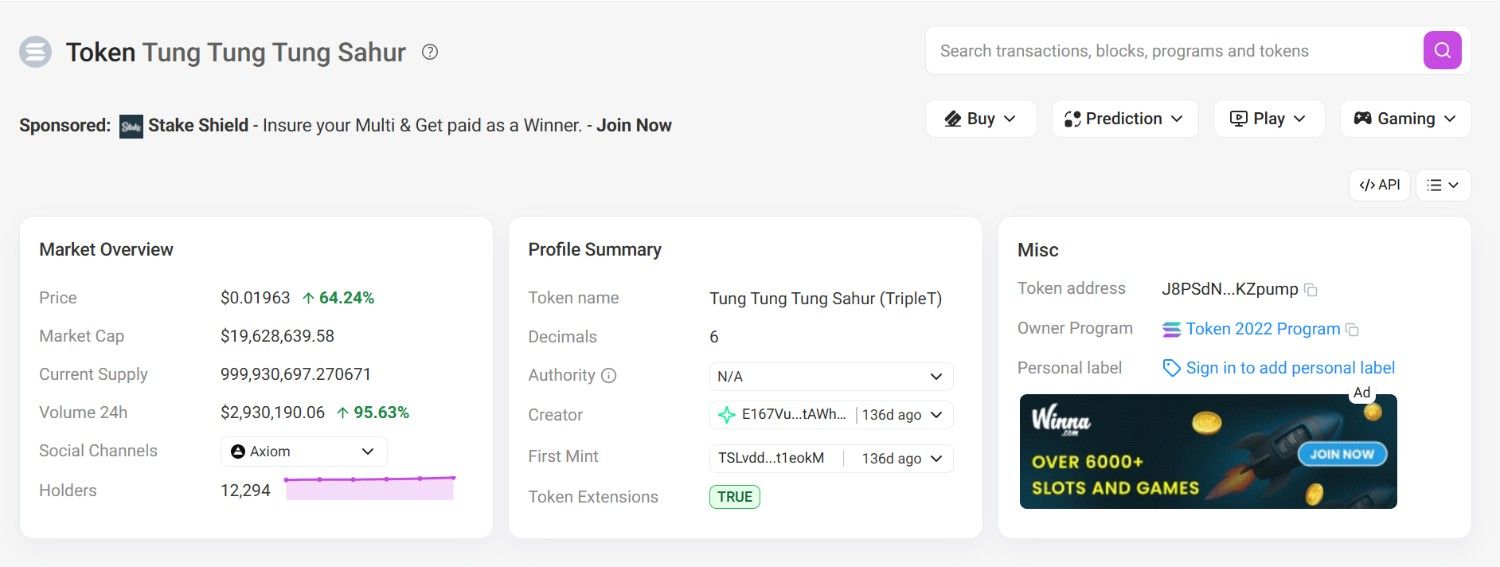
Turns out, the story isn't just hype anymore. On-chain data shows over 12,294 holders now, and that number has been climbing steadily this week.
Top 10 wallets hold about 16.32% of supply, which is not extreme for a meme coin this size. The broader altcoin market trends this month show similar spread among newer Solana tokens. That spread-out ownership is worth noting.
Source: On-chain data
Price History And Recent Performance Snapshot
Three months ago this coin traded for fractions of a cent. From a low near $0.0012 in March, it's climbed sharply, hitting a fresh all-time high of $0.02618 just hours ago.
The seven-day range alone stretches from $0.01077 to that new high. Few tokens move that wide in a week. This one just did.
TRIPLET Technical Analysis: What The Chart Is Actually Showing Traders Right Now
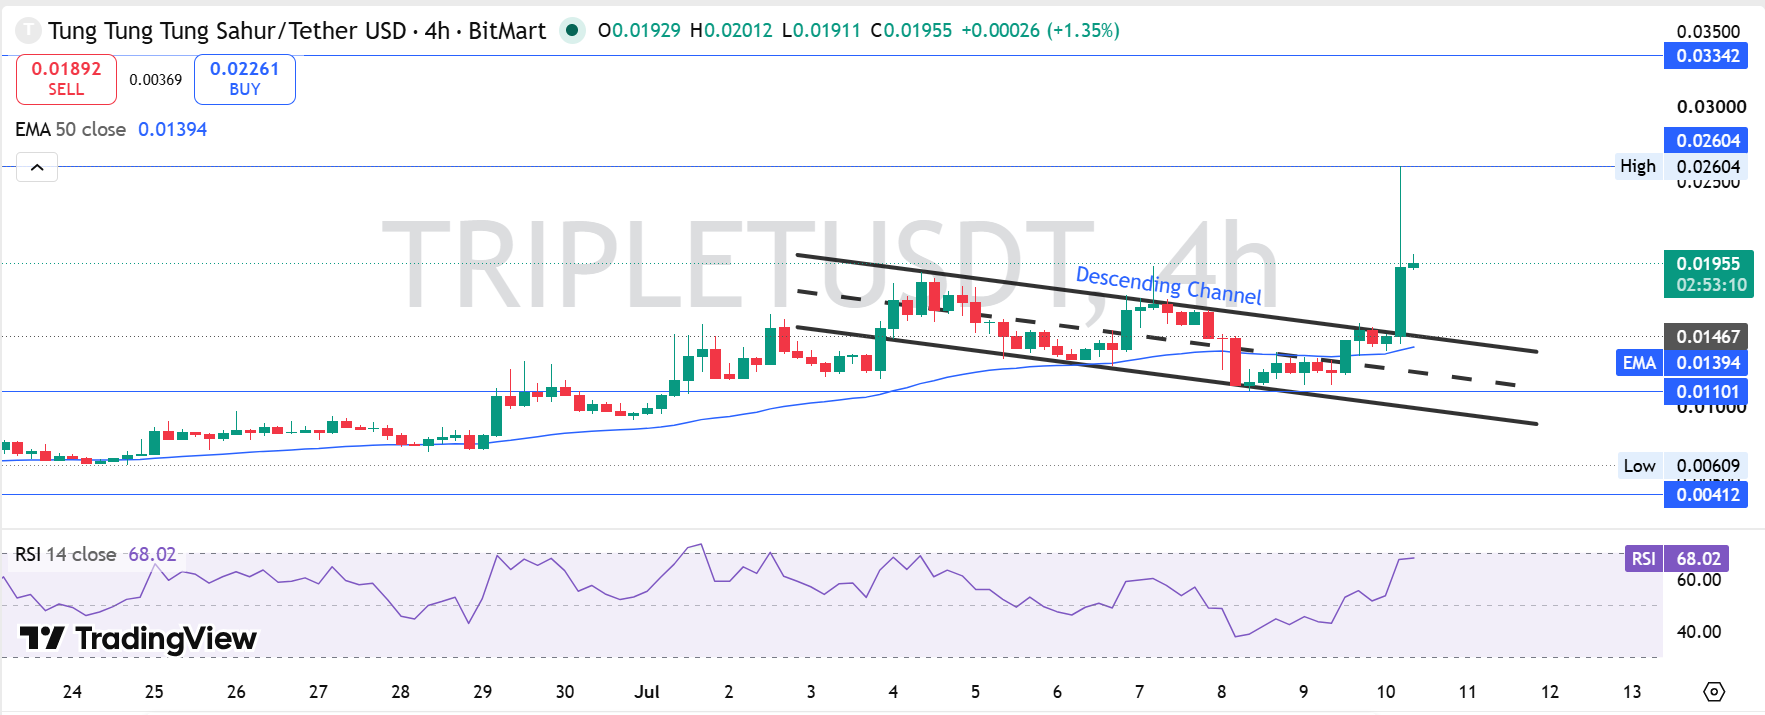
Here's what's happening under the hood. Price had been grinding inside a descending channel for nearly two weeks, coiling tighter with every bounce.
Source: Charting by TradingView
Then it broke out. Hard. The breakout candle alone pushed price from around 0.0139 toward the current 0.01955 zone in a matter of hours.
When we pulled up the RSI, the first thing that stood out was 68.02, close to overbought but not flashing danger yet. That leaves some room before sellers typically step in.
Price is trading above the 50 EMA at 0.01394, and that gap between price and average is exactly what tells you buyers are still in charge. But a gap this wide rarely holds forever.
Immediate resistance sits at 0.02604, with a bigger wall up at 0.03342. Support now lives at 0.01394, the same EMA line acting as a floor.
That's the setup. Simple, but not risk-free, and Bitcoin price outlook shifts can still pull a small-cap chart like this one off course fast.
How TRIPLET Stacks Up Against Other Meme Coins
Compared to typical low-cap Solana meme tokens, this one's volume-to-market-cap ratio is healthy, sitting near 15% of market cap traded daily. Anyone tracking crypto price predictions in this cycle knows how rare that kind of volume is for a token this small.
And that raises a bigger question: one the market hasn't answered yet. Can the volume stick around once the initial excitement fades?
Short-Term TRIPLET Price Prediction This Week
Short term, the breakout momentum favors continuation, but a pullback toward the EMA line would not be unusual before the next leg up.
| Timeframe | Bearish Target | Base Target | Bullish Target | Key Trigger |
|---|---|---|---|---|
| 24 Hours | $0.01700 | $0.01955 | $0.02150 | Volume holding above average |
| 3-7 Days | $0.01450 | $0.02100 | $0.02604 | Clean close above resistance |
| 2-4 Weeks | $0.01394 | $0.02300 | $0.03342 | Sustained buyer interest |
Watch the volume bars closely this week. Fresh exchange listings tend to be the fastest trigger for a move like this, more than the price chart alone.
Long-Term TRIPLET Price Outlook Into Next Year
Zooming out, the long-term case depends on whether holder growth keeps pace with price, not just on chart patterns.
| Timeframe | Bearish Target | Base Target | Bullish Target | Catalyst Needed |
|---|---|---|---|---|
| 3 Months | $0.00900 | $0.02200 | $0.03500 | Continued exchange listings |
| 6 Months | $0.00700 | $0.02800 | $0.04500 | Rising holder count and liquidity |
| End of Year | $0.00600 | $0.03200 | $0.06000 | Broader meme coin market recovery |
| 2027 Outlook | $0.00450 | $0.03800 | $0.08000 | Sustained community and volume growth |
The honest take: the long-term case is speculative at best right now, tied more to meme culture cycles than fundamentals. Treat it that way.
Three Realistic Price Scenarios Worth Preparing For
Worst Case: Volume dries up fast and price slides back under the EMA. A broad crypto pullback would speed this up.
Base Case: Price consolidates between 0.015 and 0.022 for a few weeks. Most meme coin breakouts cool off before their next move.
Best Case: Fresh listing news or a viral moment pushes price straight through 0.026. That kind of catalyst has happened before with this token.
| Scenario | Price Range | What Triggers It |
|---|---|---|
| Worst Case | $0.008 - $0.012 | Volume collapse and broad market weakness. |
| Base Case | $0.015 - $0.022 | Normal consolidation after the recent breakout. |
| Best Case | $0.026 - $0.040 | Viral community momentum or a new exchange listing. |
Key TRIPLET Price Levels Traders Are Watching
Resistance zone: 0.02604 and 0.03342 above current price, both prior swing highs.
Support zone: 0.01394, the 50 EMA line, has held on every recent test.
Invalidation zone: 0.00412, well below current price. A close under this would break the entire bullish structure.
Analyst View And Final Thoughts On Tung Tung Tung Sahur
Tung Tung Tung Sahur just delivered one of its sharpest moves since launch, breaking a descending channel with strong volume support behind the push. That alone shifts the near-term bias toward buyers.
RSI sitting at 68.02 shows momentum without tipping into extreme overbought territory yet, giving the rally a bit more breathing room before sellers typically return.
A weekly close holding above the 0.01394 EMA would go a long way toward confirming this breakout has legs rather than fading like so many meme coin spikes do.
Beyond the chart, keep an eye on overall crypto sentiment through the daily blockchain crypto news cycle, plus the current crypto fear and greed index. Meme coins this size tend to amplify whatever Bitcoin and Ethereum are doing on any given day.
The level that matters most from here is 0.01394. Hold it, and the bullish case stays intact. Lose it, and this entire setup needs a rethink.
Risk is still real. Timing matters here.
The setup looks more bullish than most are giving it credit for right now.
Disclaimer: This article is for educational purposes only and does not constitute financial advice. Crypto markets are volatile. Consult your investment advisor before making any investment decision.
Also read:












.webp)




