Bitcoin Price Outlook: Three Scenarios, One Big Question Mark


Bitcoin price outlook talk always gets loud right after a bad quarter, and BTC just had two of them in a row.
The coin is sitting at $63,275.64, up 0.86% in the last 24 hours. Market cap is holding near $1.26 trillion. So the question everyone is actually asking is simple: is this the bounce, or just a pause before another leg down?
What is Bitcoin's price today?
Field | Data |
Current Price | $63,275.64 |
24h Change | +0.86% |
Market Cap | $1.26T |
24h Volume | $19.26B (+6.91%) |
Volume/Market Cap | 1.51% |
Fully Diluted Valuation | $1.32T |
Circulating Supply | 20.05M BTC |
Total Supply | 20.05M BTC |
Max Supply | 21M BTC |
Treasury Holdings | 1.33M BTC |
Volume jumping almost 7% while price only moved less than 1% is worth a second look. That usually means more people are actively trading around this level, not just sitting on their hands.
Why is Bitcoin price down in 2026?
BTC opened 2026 above $93,000. It has not been anywhere close to that since.
Q1 closed down around 22%. Q2 closed down another 14%. That is back-to-back red quarters, something Bitcoin has not really done since 2022.
Most of that damage did not come from inside crypto. U.S. spot BTC ETFs posted their worst month of outflows ever in June, close to $4.5 billion pulled out, led by BlackRock's IBIT.
On top of that, the Fed under new chair Kevin Warsh held rates steady and took a planned cut off the table.
Lower rates usually push money toward risk assets like Bitcoin. Once that hope disappeared, big money had a reason to leave.
Is Q3 usually a bad quarter for Bitcoin?
Bitcoin's quarterly return history says yes, sort of. Q3 has historically been the weakest quarter of the year, with a median return of just +2.29% going back to 2013.
Q4, by contrast, has a median return of +47.73%, by far the strongest.
Quarter | Average Return | Median Return |
Q1 | +45.97% | -2.26% |
Q2 | +24.16% | +7.38% |
Q3 | +6.21% | +2.29% |
Q4 | +77.07% | +47.73% |
So far this Q3, Bitcoin is actually up around 8.3%, already ahead of its usual median. Whether that holds through September is a different question.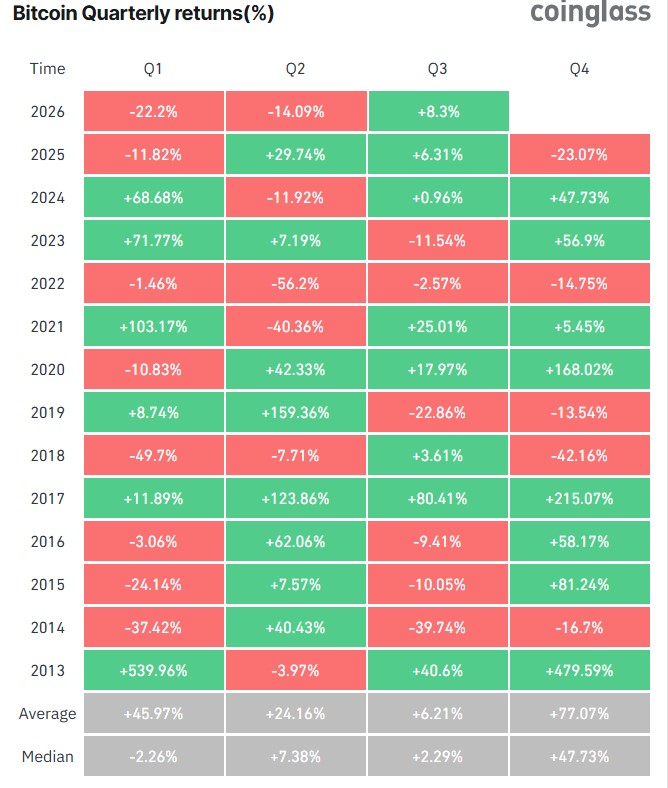
On the monthly chart, BTC price is also sitting inside a wide ascending channel that traces back to the 2018 and 2022 cycle lows. Every time price has touched the lower band of this channel, a recovery followed.
Right now, BTC is pressing up against one of the resistance zones marked on that chart from past rejection points. That is the level buyers need to clear.
Will Bitcoin go up or down next?
Worst Case: BTC loses the $58,000 to $60,000 support zone on a weekly close. That level already got tested once in late June.
A clean break below it opens the door toward $50,000, a level even bearish voices like Peter Schiff have flagged as the real danger zone.
Base Case: $BTC holds above $60,000, grinds sideways, and slowly works toward the $65,600 area, the 50-month moving average that has capped rallies since the drop began.
Best Case: BTC reclaims $65,600 and pushes toward $70,000. This needs ETF outflows to reverse and the whale accumulation seen over the past two weeks to keep going.
Scenario | Price Range | What Triggers It |
Worst Case | Below $50,000 | Loss of $58K support, ETF outflows continue |
Base Case | $60,000 to $65,600 | Sideways grind, support holds |
Best Case | $65,600 to $70,000 | ETF inflows return, whale buying continues |
What is Bitcoin's support and resistance level right now?
Immediate support at $58,000 to $60,000: This zone held during the February crash. It already saw one weekly close below it in late June, which is not a great sign, but it has not broken down completely yet.
First resistance at $65,600: The 50-month moving average. A weekly close above this would be the first real signal that buyers have taken back control.
Invalidation below $50,000: If Bitcoin loses the $58K zone and keeps falling, this is the next real floor anyone is watching.
Are Bitcoin whales buying or selling right now?
On-chain data shows whales have added more than 270,000 BTC over a recent two-week stretch. That is not little money. It suggests larger holders see this price as a discount rather than a warning sign.
Network activity backs that up too. Active Bitcoin addresses jumped about 9%, climbing above 660,000, meaning more coins are actually moving, not just sitting idle in wallets.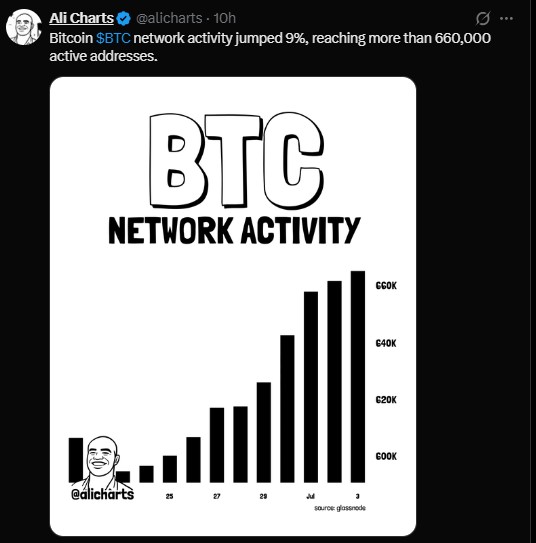
A trader known online as Ted pointed out that Bitcoin's current price structure looks a lot like Q3 2022.
If that fractal repeats, the theory goes July closes green before a fresh cycle low forms later on. Worth watching, but it is a pattern, not a promise.
Some traders have also pointed out that Bitcoin posted a July gain of 20% or more in every past bear market. That is an interesting stat. It is also a small sample size, and past Julys do not vote on what this one does.
Is the Tether (USDT) outflow a warning sign for Bitcoin?
A widely shared post this week flagged something else. Tether's (USDT) market cap dropped $3 billion in just three days.
The post drew a direct line to two past setups: right before BTC fell from $90,000 to $60,000, and again before it dropped from $80,000 to $58,000.
Here's the thing, though. Stablecoin outflows happen for a lot of reasons: redemptions, exchange rebalancing, money rotating into other stablecoins.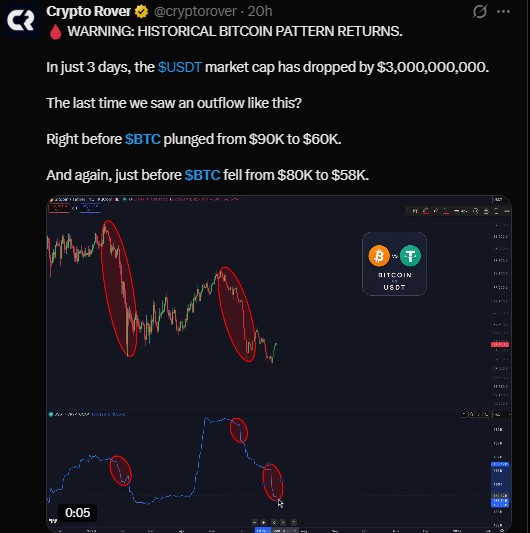
It is not automatically a crash signal. But given the history, it is not something to wave off either.
Watch this one alongside the ETF flow data, not instead of it.
Will Bitcoin recover in 2026?
The whole Bitcoin price outlook right now comes down to one zone: $58,000 to $60,000.
Whale accumulation, rising network activity, and a Q3 that is beating its own seasonal average all point toward cautious optimism.
Record ETF outflows, a Fed in no rush to cut, and a stablecoin outflow warning point the other way.
Nothing here guarantees which way this breaks. Watch the support zone. If it holds, the setup for a slow grind higher is there.
If it doesn't, the next real floor may be a lot lower than most people are pricing in right now.
Disclaimer: This article is for educational purposes only and does not constitute financial advice. Crypto markets are highly volatile. Consult your investment advisor before making investment decisions.
Also read:







.webp)








