Bitcoin Price Flashes a Warning: Is $47.5K the Real Floor Now?


What is the Bitcoin price today?
Bitcoin price sits at $62,712.8, down 0.75% over the past day. The coin briefly rebounded toward $64,100 before slipping back under pressure.
Trading volume fell sharply. Spot volume dropped 20.87% to $62.02 billion. Futures open interest also eased, down 2.34% to $45.85 billion.
The daily chart shows BTC price stuck inside a descending channel. Price is printing lower highs since the May peak near $80,000.
What is Bitcoin's electrical cost floor?
As per TED, Bitcoin miners spend real money on power to run their machines. This cost forms a rough "floor" under Bitcoin price.
That floor has now dropped to almost $47,500. A lower floor usually means miners can survive at lower prices, which some traders read as a warning sign for weaker support ahead.
This matters because $BTC price has moved close to this zone before during past corrections.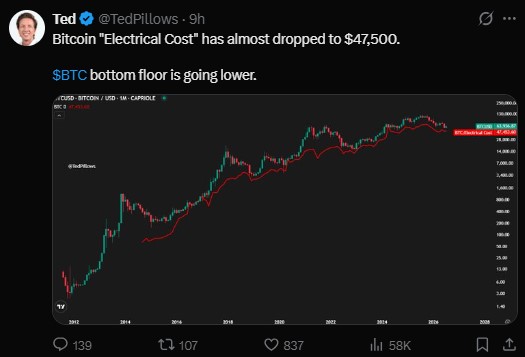
Does Bitcoin price ever bottom below the realized price?
According to on-chain data from Bitbo, $BTC has never closed a market cycle bottom above its realized price line.
The realized price tracks the average cost basis of all coins on the network. Right now, the gap between market price and realized price is fairly tight.
Past cycle bottoms lasted between 122 and 303 days below this line, based on historical data shown on the chart.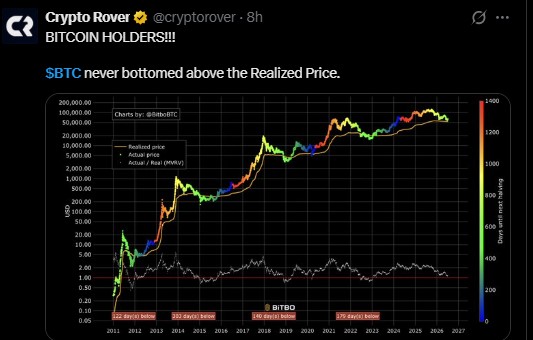
Is Bitcoin price forming a bearish fractal pattern?
Chart analysts point to a repeating pattern this cycle. It includes a rising channel, a 1-2-3 formation, and a rejection at point 4.
The first version of this pattern led to a 30% drop earlier this cycle. Some analysts believe a second version just completed its point 4 rejection.
Technical Level | Price Zone |
Major Supply Zone | $85,000 – $90,000 |
Primary Downside Target | $47,839 |
Extended Downside Target | Below $47,800 (up to -54%) |
Bearish Structure Invalidation | Daily close above $74,156 |
If the price closes above $74,156 on the daily chart, this bearish structure would lose its validity.
Is crypto market sentiment bullish or bearish right now?
Sentiment has swung fast this month. Traders called for lower prices in early June, turned bullish mid-June, then feared another drop after BTC hit $58,100 in late June.
Now that the price has bounced back near $64,100, the crowd leans bullish again.
This kind of quick sentiment flip is often used as a contrarian signal. Crowded bullish calls sometimes come right before a cooling-off period, not before a bigger breakout.
How much was liquidated in crypto in the last 24 hours?
Liquidations picked up sharply over the past 24 hours. CoinGlass data shows 123,492 traders were liquidated, with total losses reaching $352.37 million.
The single largest liquidation order hit Binance on the ETH/USDT pair, worth $7.24 million.
Long positions took the biggest hit across most timeframes. In the 24-hour window, longs lost $41.47 million compared to $30.13 million in shorts.
Liquidation Window | Long Losses | Short Losses |
1 Hour | $384.71K | $71.03K |
4 Hour | $14.78M | $2.06M |
12 Hour | $23.75M | $8.64M |
24 Hour | $41.47M | $30.13M |
This shows leveraged long traders are still getting caught out whenever the price dips.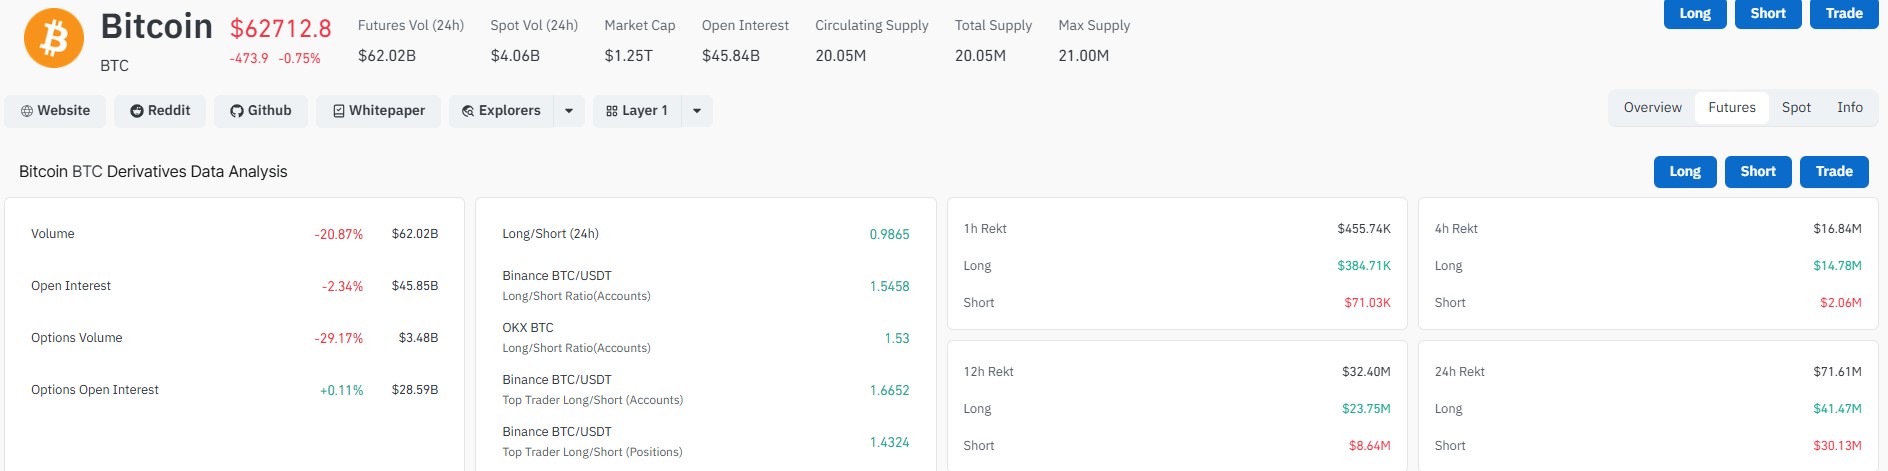
What do Bitcoin futures and open interest show today?
Derivatives data paints a mixed picture. Long/short ratio on Binance BTC/USDT sits at 1.5458, showing more traders are positioned long than short.
Options open interest ticked up slightly by 0.11% to $28.59 billion, even as options volume fell 29.17%.
Metric | Value | 24h Change |
Spot Volume | $62.02B | -20.87% |
Open Interest | $45.85B | -2.34% |
Options Volume | $3.48B | -29.17% |
Options Open Interest | $28.59B | +0.11% |
What is the Bitcoin price prediction for the next few weeks?
The RSI on the daily chart reads 47.86, sitting close to neutral territory. This suggests Bitcoin price has room to move in either direction without being overbought or oversold.
$BTC price remains boxed inside a descending channel with resistance layered near $65,500 to $67,500. A break above $74,156 would shift the picture toward bulls.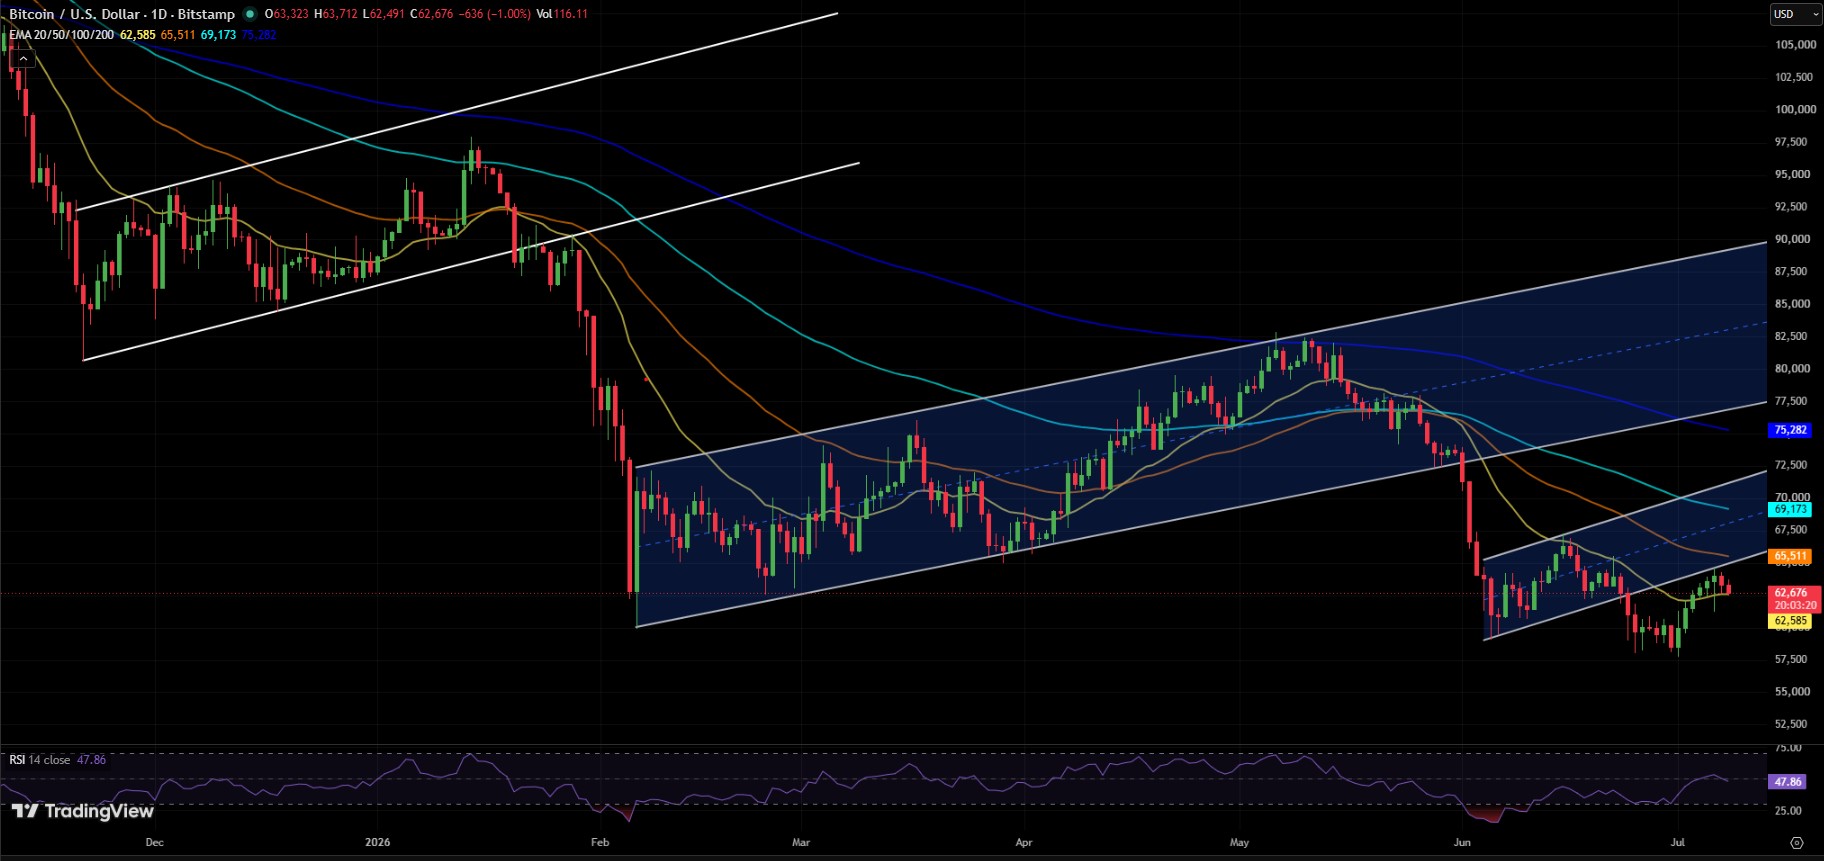
On the downside, a drop below the $58,000 zone could open a path toward the $47,839 target flagged by chart watchers. Nothing here is guaranteed, and Bitcoin price outlook has surprised traders in both directions before.
Disclaimer
This article is for informational purposes only and does not constitute financial, investment, or trading advice. Cryptocurrency markets are highly volatile and risky. Always do your own research and consult a licensed financial advisor before making investment decisions. Past performance does not guarantee future results.











.webp)





