Bitcoin Price Prediction Today: BTC Stalls at $80,000, What's Next?


Bitcoin price is running out of steam right at the $80,000 wall. After three straight days of gains, buyers pushed BTC to a high of $79,463.71, but the rally lost almost 3% from that peak in a hurry.
This pullback has traders asking a simple question. Will Bitcoin price break above $80,000, or is a deeper correction coming?
Right now, BTC is testing the 50-week EMA near $77,237 and sitting just under the 100-week EMA around $78,451. Both levels sit close together, and that cluster is proving tough to crack.
Why Did Bitcoin Price Pull Back From $80,000?
As per CoinGlass Data, a large sell wall appeared right at the $80,000 mark on the order book, based on whale order tracking data. This kind of wall often signals a big holder is not ready to let price run higher just yet.
Sell walls like this are common at round numbers. Traders watch $80,000 closely because it is a psychological level, and big players sometimes place orders there to slow down a rally or take profit.
The 15-minute chart shows Bitcoin topping near $79,955 before sliding back toward $77,265. Whale order data marks heavy resistance stacked between $79,000 and $81,000, while green support lines sit lower, around $74,000 to $76,000.
What Is Driving Bitcoin Price This Week?
Bitcoin rallied hard this week on a mix of factors. Institutional demand grew, liquidity expectations improved, and optimism around U.S. policy added fuel to the move.
Billionaire investor Ray Dalio has again pointed to Bitcoin and gold as hedges against the growing U.S. debt problem. His comments landed as U.S. debt crossed the $40 trillion mark, with BTC rallying to nearly $80,000 for the first time since May.
Dalio said on X that he suggests spreading money across asset classes and countries with strong balance sheets. He advised underweighting bonds and holding more gold, along with a smaller allocation to Bitcoin.
He also noted that keeping 10% to 15% of a portfolio in gold can lower overall risk. His remarks come as BTC rallied from lows near $63,000 earlier in the week.
Part of the rally traces back to the U.S. Treasury's plan to at least double its debt buyback, announced after the 30-year yield hit its highest level since 2007. That same day, U.S. debt topped $40 trillion, and BTC jumped above $70,000 soon after.
Dalio warned that the government's financial situation is nearing a point where debt could become unmanageable "without great trauma." He said it is better to address the problem while the economy is still strong rather than waiting for a downturn.
"That is because when the economy is in a contraction, the government's borrowing needs increase a lot," he explained. He also pointed out that political shifts and wars can speed up or delay a debt crisis.
How Are Inflation and Fed Policy Affecting Bitcoin Price Today?
The U.S.-Iran war continues to weigh on the broader economy, pushing energy prices and inflation higher. This has added downward pressure on Bitcoin price in recent sessions.
Fed Chair Kevin Warsh has promised to keep prices stable, even as the FOMC faces calls to raise rates and fight inflation. According to Polymarket data, the odds of a Fed rate hike have climbed back above 50% as the Treasury works to calm the bond market.
Traders this week are watching U.S. PCE inflation, GDP growth, and job data closely. These releases will help shape whether the current crypto market rally has more room to run.
A hotter inflation print or stronger job numbers could pressure rate-cut hopes and hurt Bitcoin price. Softer data, on the other hand, could support BTC and other risk assets.
Are Bitcoin ETFs Still Seeing Inflows?
Yes. Spot BTC ETFs recorded $307 million in net inflows on August 21, marking five straight days of inflows. This steady demand from institutional products has been a quiet but steady support for Bitcoin price through the recent swings.
Bitcoin Liquidations: How Much Got Wiped Out?
The BTC derivatives market saw a mixed liquidation picture across different timeframes.
Timeframe | Total Liquidations | Long Liquidations | Short Liquidations |
1 hour | $2.23 million | $1.08 million | $1.15 million |
4 hours | $62.21 million | $46.08 million | $16.14 million |
12 hours | $154.29 million | $56.50 million | $97.79 million |
24 hours | $484.79 million | $180.24 million | $304.55 million |
Over the last day, short positions took the biggest hit, with $304.55 million wiped out compared to $180.24 million in longs. This suggests traders betting against Bitcoin got caught off guard by the sharp rally earlier in the week.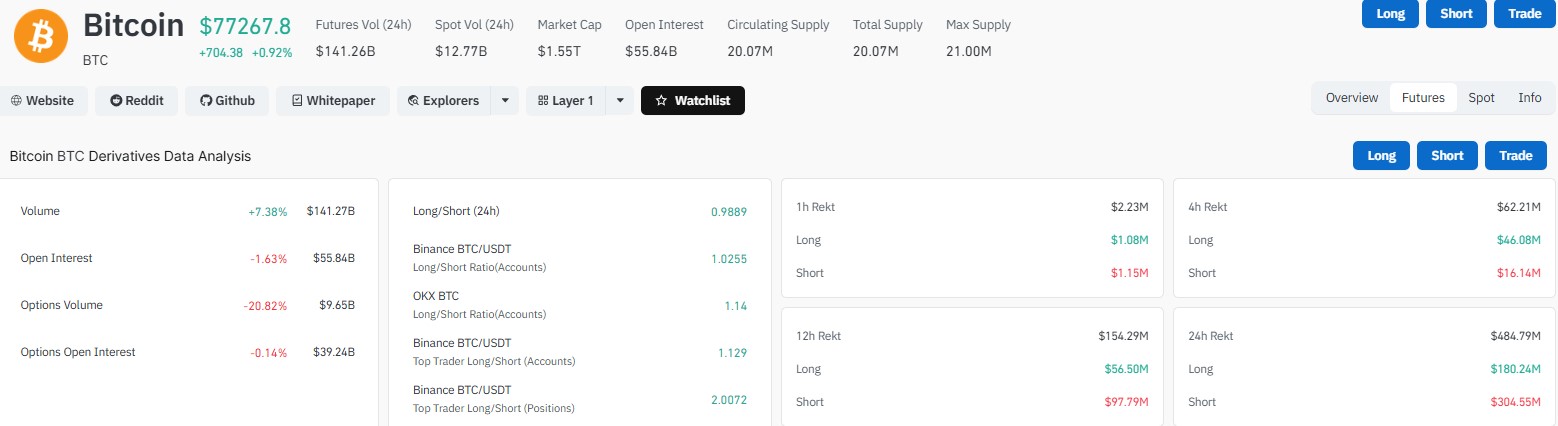
Bitcoin Weekly Price Prediction: What Do the Charts Say?
Looking at the weekly BTC/USD chart, the asset is showing a strong bounce from the $60,000 to $62,000 support zone. The pattern looks like a higher-low recovery followed by a strong bullish weekly candle. BTC now trades around $77,358.
The EMA structure matters here. The coin has reclaimed the 20-week EMA near $69,239, which now acts as dynamic support underneath the market.
But price is currently testing the 50-week EMA around $77,237 and remains just below the 100-week EMA near $78,451. Together, these form a resistance cluster between $77,000 and $79,000. A decisive weekly close above this zone would strengthen the bullish case.
Key Resistance and Support Levels
Level Type | Price Zone | Note |
Major resistance | $83,000 | Aligns with horizontal chart resistance |
Resistance cluster | 77,000–79,000 | 50-week and 100-week EMA zone |
Support | $69,200 | 20-week EMA |
Support | $68,500 | 200-week EMA |
Downside risk zone | 60,000–62,000 | Prior support base |
The next big resistance sits near $83,000, which lines up with horizontal resistance on the chart too. A weekly close above $83,000 could open the door to a larger bullish move, with potential targets in the $90,000 to $95,000 range, and possibly $100,000-plus if momentum holds.
On the flip side, rejection from the $77,000 to $83,000 zone could trigger a pullback. The first support to watch is the 20-week EMA near $69,200, followed by the 200-week EMA around $68,500.
Holding the $68,500 to $69,500 range would keep the medium-term recovery intact. A weekly close below the 200-week EMA would weaken the bullish setup and could open the door back to $60,000 to $62,000.
The weekly RSI sits around 56 right now. That is bullish territory, but not overbought, which means the asset still has room to climb if resistance breaks. A short-term pause around the current EMA resistance would not be unusual, though.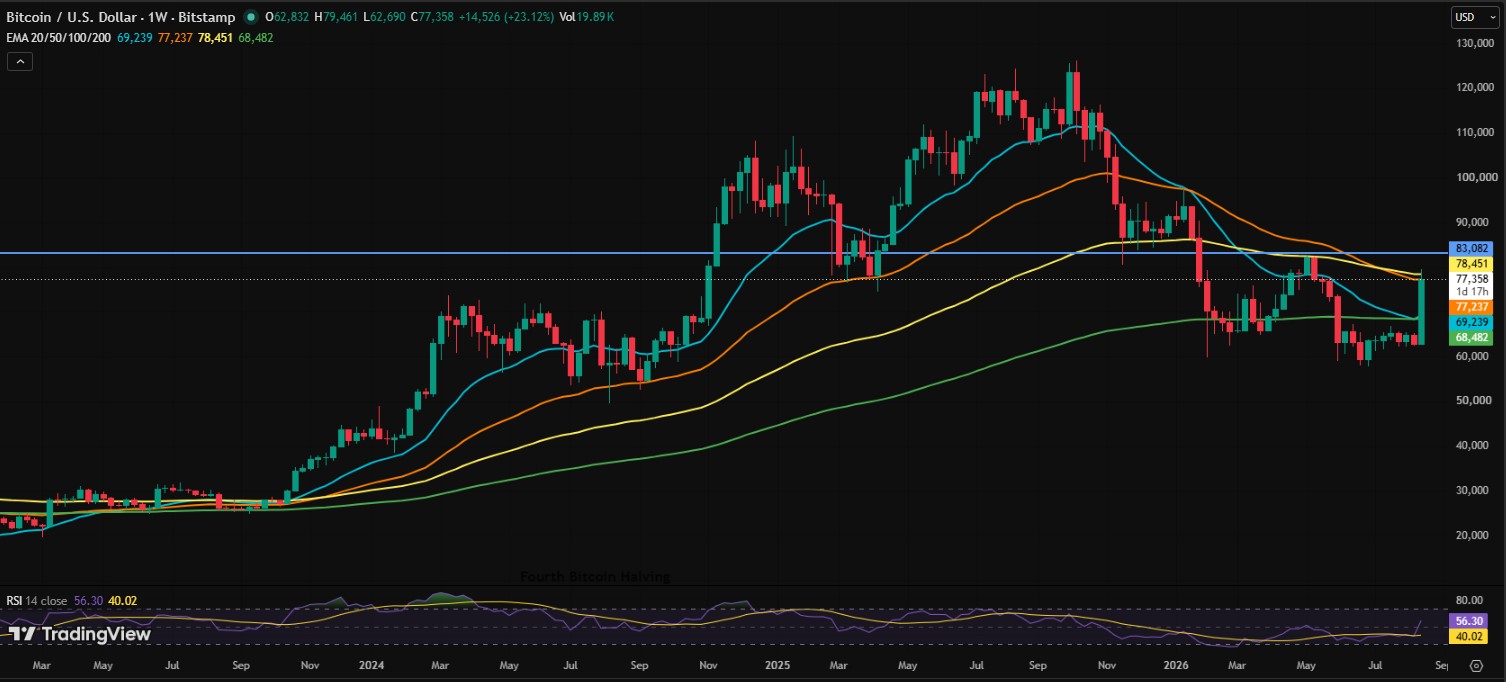
Bottom Line
Bitcoin price prediction for the coming week hinges on whether BTC can close above the $77,000 to $79,000 EMA cluster and eventually clear $83,000. Macro data and the visible sell wall near $80,000 add uncertainty in the near term.
Disclaimer
This article is for informational purposes only and does not constitute financial, investment, or trading advice. Past performance is not indicative of future results. Readers should conduct their own research and consult a licensed financial advisor before making any investment decisions.











.webp)





