Bitcoin Price Prediction: BTC Eyes $80K After Massive Short Squeeze


Bitcoin is back in the headlines. The Bitcoin price jumped to $78,003, up 6.84% on the day, according to TradingView data from Bitstamp. This is one of the sharpest moves in weeks, and it has traders asking where BTC goes next.
This Bitcoin news today comes after a rough stretch for the market. BTC is still about 39% below its October record near $126,000. So this rally is a bounce inside a down year, not a new high.
Still, the speed of the move matters. Let's break down what is driving this Bitcoin price prediction.
What Is Driving Bitcoin's Price Today?
Bitcoin trades near $78,050 as of this writing, up 8.57% on the day, extending a run that carried BTC from below $64,000 earlier in the week.
The 24-hour range ran from a low of $71,115 to a high near $78,220, before pushing even higher into the $78,000s. Market cap has climbed past $1.56 trillion again.
A few things lined up at once:
Short squeeze pressure. Roughly $822 million was liquidated across the market in 24 hours. Shorts made up about $750 million of that, with longs at just $73 million.
Rising futures activity. Futures volume jumped 9.22% to $150.44 billion. Open interest rose 5.98% to $57.44 billion.
Bullish positioning among big traders. The top-trader long/short ratio sits near 1.92, much higher than the overall account ratio of 1.08.
ETF demand. U.S. spot bitcoin ETFs pulled in $606.29 million on August 20, up from $517 million the day before, according to SoSoValue.
Put together, this looks like leveraged short positions getting forced out, adding fuel to an already strong move. This matches the broader market picture too, where more than $3 billion in crypto short positions were reportedly liquidated during the breakout, making it one of the larger short squeezes seen in recent years.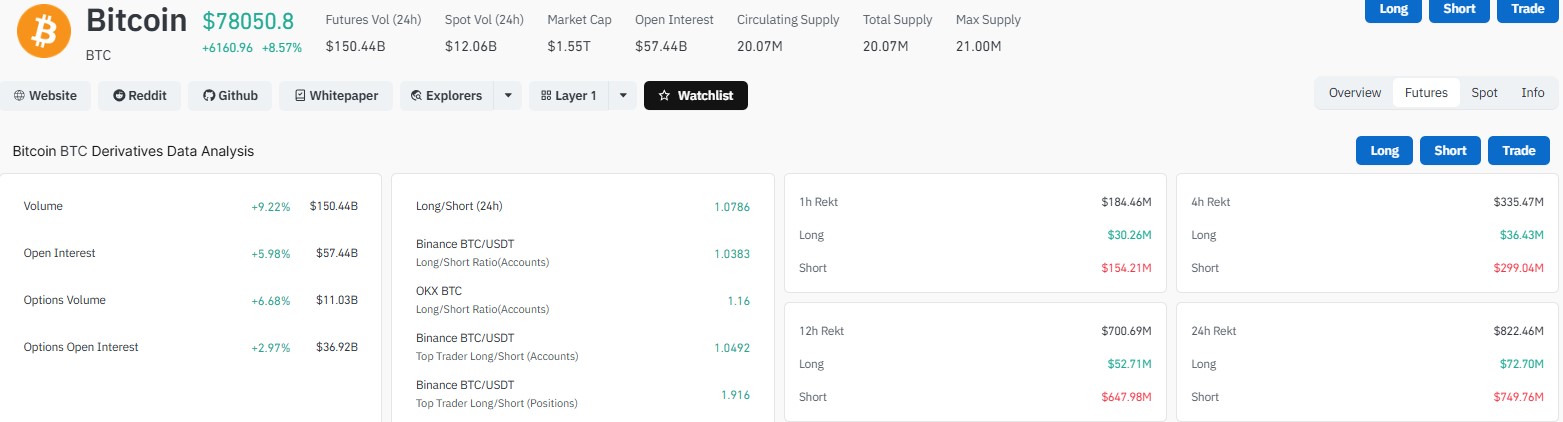
Is Bitcoin Price Bullish Right Now?
The daily chart backs up the bullish case, at least in the short term.
BTC has broken above its 20, 50, and 100-day EMAs, which sit at $66,441, $65,362, and $66,738. It also cleared the 200 EMA near $71,577, a level that had capped price for weeks.
That is a strong signal. When price sits above all major EMAs, it usually means buyers are in control.
But there's a catch. The RSI reading is 85.67, which is deep in overbought territory. Above 70 is typically considered stretched.
A reading near 86 suggests the move may be running hot, and some cooling off would not be surprising.
Bitcoin Price Prediction: Key Levels to Watch
Level Type | Price Zone | What It Means |
Immediate Resistance | 78,000–80,000 | Current battle zone for bulls |
Next Resistance | $82,500 | Confirms continuation if closed above |
Extended Target | $85,000 | Possible if $82,500 flips to support |
First Support | $75,000 | First line of defense on a pullback |
Major Support | $71,577 (200 EMA) | Losing this weakens the bullish case |
If $BTC close a daily candle above $82,500, that would open the door toward $85,000. This is not a guarantee, just a technical possibility based on current chart structure.
On the flip side, a drop below $71,577 would put the recent bullish structure at risk and could bring sellers back in.closes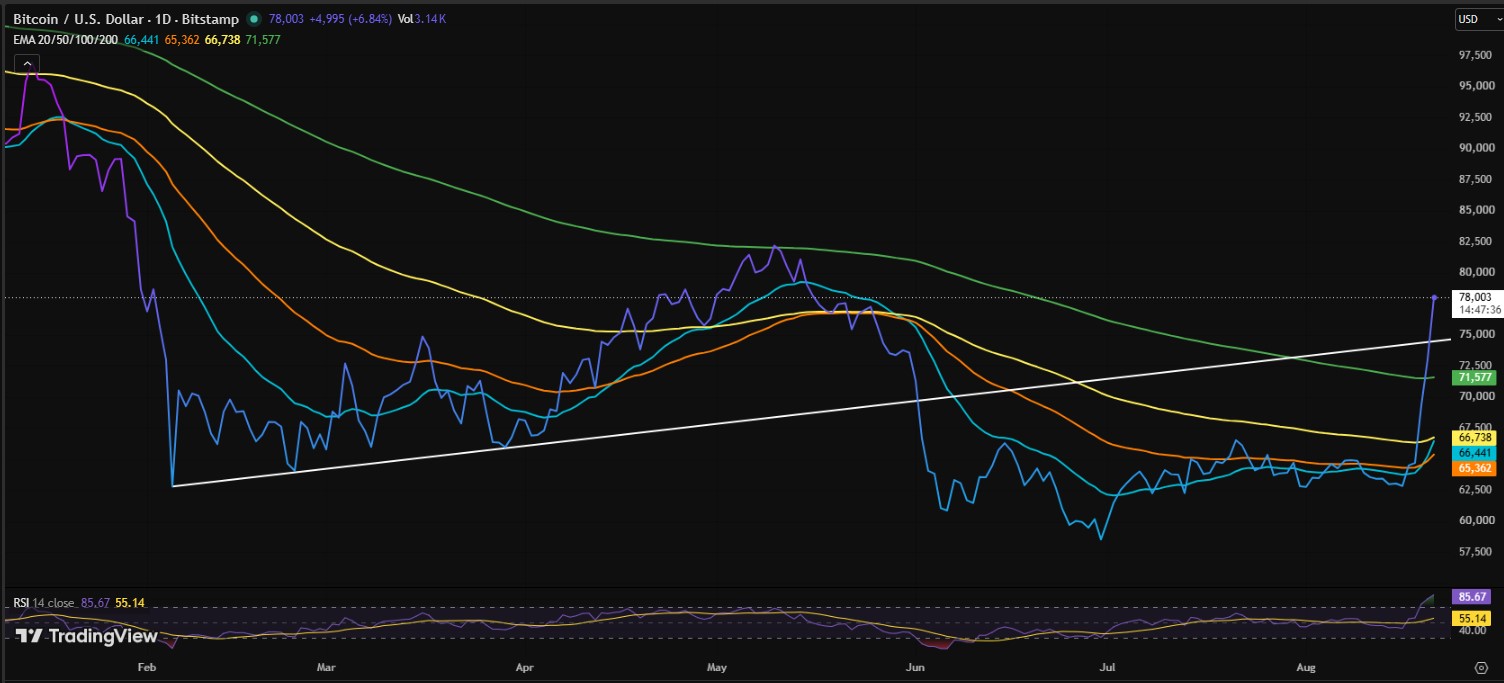
Whale and Institutional Activity
Institutional buyers have not stepped back. Strategy, the company led by Michael Saylor, now holds 840,447 BTC. Its average cost per coin sits at $75,653, meaning the firm is back in profit territory after this move.
This kind of large-holder activity often gets watched closely by traders as a sign of longer-term confidence, separate from the short-term leverage unwind happening in futures markets.
What This Means for BTC News Today
The bigger picture: this bitcoin price forecast leans bullish for the near term, but the RSI warns that a pause or pullback would not be unusual after such a fast climb.
Traders watching bitcoin price news should keep an eye on whether BTC can hold above $75,000 on any dip. That would keep the broader structure intact heading into the next test at $80,000.
None of this is set in stone. Crypto markets move fast, and squeezes can reverse just as quickly as they build.
Disclaimer: This article is for informational purposes only and does not constitute financial, investment, or trading advice. Cryptocurrency markets are highly volatile and involve significant risk. Always do your own research and consult a licensed financial advisor before making investment decisions. Past performance is not indicative of future results.










.webp)






