Bitcoin Price Struggles Near $63,500 as Whale Sales Cloud Outlook


Bitcoin is stuck in a tight spot this week. The price is sitting under $65,000, and a mix of whale selling, falling spot volume, and record-low volatility is making traders nervous about what comes next.
BTC changed hands near $63,500 to $64,000 in recent sessions, based on data from CoinMarketCap. That is well off the summer highs and shows the coin has lost some steam since June.
Why Is Bitcoin Struggling to Break $65,000?
Bitcoin has had a hard time pushing past the $65,000 mark for several days now. Analyst Ted Pillows pointed out that even with stocks and metals rising, BTC could not hold above that level.
He noted momentum is fading. His chart work suggests $BTC could slide toward $60,500 to $61,000 before any bounce back happens.
That kind of pullback would not be shocking. $BTC has tested similar zones before during quiet summer trading.
What Is Driving the Whale Selling Pressure?
On-chain data from Lookonchain shows a wallet linked to Paxos sold another 800 BTC, worth about $50.72 million, through the trading firm Wintermute. That sale happened roughly eight hours before the report.
Zooming out, this same whale has offloaded 2,500 BTC over the past two months. That adds up to close to $154 million in Bitcoin sold off steadily rather than all at once.
Steady selling like this does not usually crash a market on its own. But it does add supply pressure at a time when buyers are already hesitant.
How Low Could Bitcoin Spot Volume Go?
Glassnode data, shared by Wu Blockchain, shows BTC spot exchange volume has dropped to its lowest point since the firm started tracking this data back in 2019.
BTC is currently boxed in between two key levels. The $63,000 median realized price acts as a floor of sorts, while the $68,700 short-term holder cost basis is acting like a ceiling.
Glassnode flagged that thin order books and heavy leverage could make any drop worse than usual. The firm pointed to $58,500, the June low, as a level to watch if support breaks.
Seller exhaustion signals are creeping closer to levels seen at past bear market bottoms. But actual spot demand remains soft, with only modest ETF inflows and coins still moving onto exchanges.
Is Low Volatility Setting Up a Big Bitcoin Move?
Crypto Rover flagged something worth noting. Bitcoin's volatility has dropped to its lowest point since October 2023.
The last time volatility got this quiet, $BTC went on to gain more than 330%. That does not guarantee a repeat, but low volatility often comes before a sharp move in either direction.
The question traders are asking now is simple: does this squeeze resolve upward or downward?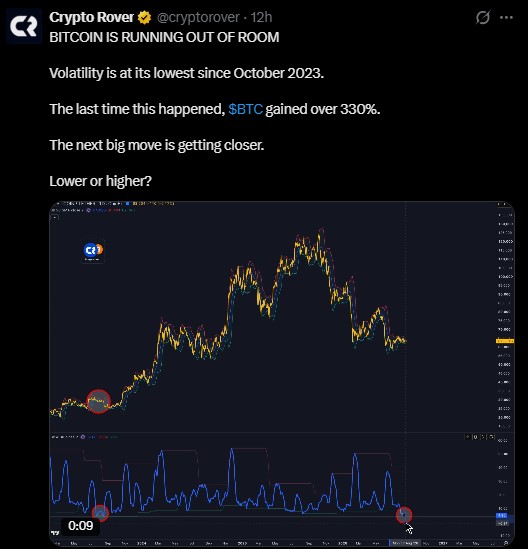
BTC ETF Flows and Market Data Snapshot
Metric | Value |
BTC Price (recent) | ~$63,500-$64,000 |
Resistance Level | $65,000-$68,700 |
Support Level | $60,500-$61,000 |
Key Downside Risk Level | $58,500 |
Median Realized Price | $63,000 |
Short-Term Holder Cost Basis | $68,700 |
Spot ETF Net Outflows (Aug 12) | $61.16 million |
Largest ETF Outflow | Fidelity FBTC, $46.82 million |
Whale Sale (Paxos-linked) | 800 BTC ($50.72M) |
Whale Total Sold (2 months) | 2,500 BTC ($154M) |
Volatility Level | Lowest since October 2023 |
What Do ETF Outflows Say About Bitcoin Demand?
U.S. spot Bitcoin ETFs saw $61.16 million in net outflows on August 12. Fidelity's FBTC fund led the redemptions with $46.82 million pulled out.
Outflows like this suggest institutional demand has cooled off for now. Combined with weak spot volume, it paints a picture of a market waiting for a clearer signal before committing new money.
Could Regulatory News Move Bitcoin This Week?
There is a possible catalyst on the calendar. The U.S. Securities and Exchange Commission could introduce new crypto industry initiatives soon, including a proposed rule for a tailored offering regime covering certain crypto investment contracts.
Separately, some traders are watching a longer-term pattern. Bitcoin has historically bottomed in the second half of midterm election years, and there is chatter that the CLARITY Act could pass within a similar window. Whether these line up again this cycle remains an open question.
Bitcoin Price Outlook: What Traders Are Watching Next
Putting it together, BTC price sits at a crossroads. Momentum is fading below $65,000, whale selling continues in the background, and spot volume has thinned out to multi-year lows.
At the same time, volatility compression and seller exhaustion signals hint that a bigger move, in either direction, may not be far off. A drop toward $60,500 to $61,000, or even $58,500 in a worse case, is on the table if support gives way.
On the flip side, a break above $68,700 would flip the short-term picture and could reopen the path toward new local highs. For now, the market looks like it is holding its breath.
Disclaimer
This article is for informational purposes only and does not constitute financial, investment, or trading advice. Cryptocurrency markets are highly volatile and risky. Prices mentioned are based on data available at the time of writing and may change quickly. Always do your own research and consult a licensed financial advisor before making investment decisions.
Also read:

















