Bitcoin Whales Keep Buying as CLARITY Act Stalls in the US Senate


Bitcoin is trading near $64,500 this week, sitting well below its October 2025 record of $126,198.
The price has been stuck in a tight range for weeks, but a mix of on-chain data and technical signals is giving traders something to watch.
Several charts making the rounds this week point to a possible bottom forming. At the same time, a stalled crypto bill in the US Senate is adding a dose of uncertainty. Here is what the data actually shows.
What is the current Bitcoin price today?
BTC opened Wednesday near $64,050 and climbed to about $64,650 in early trading. That is up slightly from Tuesday's open around $63,460. Over the past week, BTC has held mostly between $62,600 and $65,000.
The coin remains far off its all-time high. It is also trading below its 100-day and 200-day averages, which suggests the medium-term trend is still corrective rather than bullish.
Date (Aug 2026) | BTC Opening Price | Change |
Aug 3 | $63,497 | +1.2% |
Aug 4 | $63,464 | Flat |
Aug 5 | $64,053 | +0.9% |
Aug 6 (intraday) | ~$64,650 | +0.9% |
Is Bitcoin's net capital flow showing a bottom signal?
Analyst Ali Charts pointed to a bullish divergence between Bitcoin's price and its Net Capital Flow reading, based on Glassnode data. The last time this pattern appeared, BTC rose from around $15,000 to $126,000 over the following cycle.
The same divergence pattern has reportedly shown up again. Net Capital Flow measures money moving into and out of Bitcoin, and sharp red spikes below zero have historically lined up with cycle lows.
This does not guarantee a repeat performance. Past patterns can fail, and macro conditions today differ from those earlier cycles.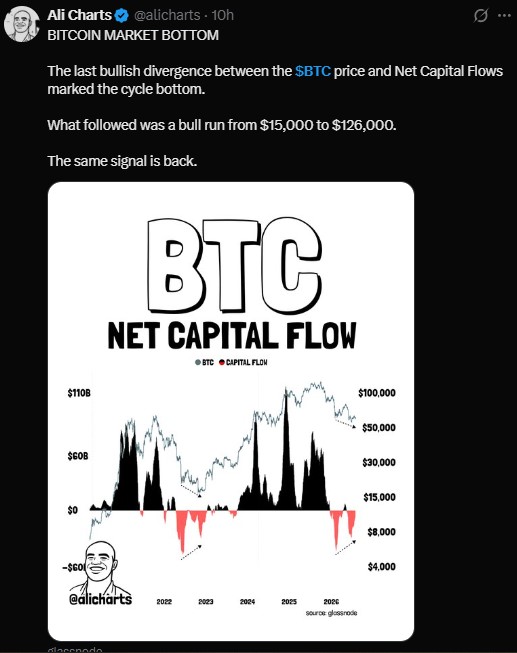
What does the SuperTrend indicator say about Bitcoin right now?
The SuperTrend indicator flipped bullish on Bitcoin this week. The last time this happened, on July 3, BTC rallied 16% from about $57,700 to $68,900 within weeks.
SuperTrend is a trend-following tool that flips between buy and sell zones based on price and volatility. A fresh buy signal does not promise the same size move, but it does mark a shift in short-term momentum.
Does the falling wedge pattern support a Bitcoin breakout?
Chart watchers, including Crypto Rover, have flagged a falling wedge pattern on Bitcoin's chart. A falling wedge is a pattern where price makes lower highs and lower lows that converge, often followed by a move higher.
The pattern has appeared twice on recent BTC charts, with what traders labeled "smart money" buy zones near each wedge low. Wedge breakouts are common technical setups, though not every wedge resolves upward, and confirmation only comes after price actually breaks the upper trendline.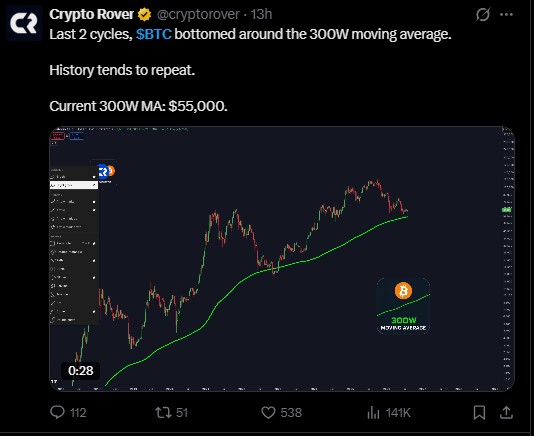
Are whales accumulating Bitcoin this week?
On-chain tracker Lookonchain reported that four newly created wallets received 1,540 BTC, worth about $99.4 million, from Galaxy Digital and BitGo within a three-hour window.
Large, fresh wallet inflows like this often draw attention because they can signal institutional buying rather than retail activity. It is worth noting that wallet activity alone cannot confirm intent, since coins could be moving for custody, OTC settlement, or other reasons.
Where is Bitcoin's 300-week moving average right now?
The 300-week moving average currently sits near $55,000. In the last two market cycles, BTC found its cycle low close to this long-term average.
If that pattern holds again, the $55,000 zone could act as a floor. Bitcoin has not traded near that level in recent months, so it remains a reference point rather than an active support test.
How is the CLARITY Act affecting Bitcoin sentiment?
Crypto market sentiment is also tied to Washington this week. Wednesday's Senate cloture filing did not include the CLARITY Act, which sets clear rules for digital assets. That means the standard process no longer allows a Friday floor vote.
The only paths left are unanimous consent to fast-track the bill or extending the Senate session into the weekend. Senator Cynthia Lummis said she expects the Senate to stay in session and vote, though many see that outcome as unlikely.
Delays to the bill add regulatory uncertainty for crypto markets, which have been waiting on clearer federal rules for how digital assets are classified and traded.
Bitcoin technical levels to watch this week
Level Type | Price |
Immediate support | $63,900 |
Intraday range | $63,898 - $65,000 |
20-day EMA | $63,943 |
50-day EMA | $64,587 |
100-day EMA | $67,025 |
200-day EMA | $72,569 |
300-week MA | $55,000 |
All-time high | $126,198 |
If BTC clears the 50-day EMA near $64,587, the next test sits around $66,000 to $67,000. A drop below $63,900 could open the door back toward $62,600.
Bitcoin price prediction: what happens next?
Bitcoin sits at a crossroads. On-chain data and momentum indicators point toward possible upside, backed by whale accumulation and historical pattern repeats. Meanwhile, stalled legislation in Washington keeps a lid on broader risk appetite.
Traders will likely watch the 50-day EMA as a near-term pivot point, alongside any late developments on the CLARITY Act vote. Nothing here is a guarantee. Markets can and do move against even the cleanest-looking chart pattern.
Disclaimer
This article is for informational purposes only and does not constitute financial, investment, or trading advice. Always conduct your own research and consult a licensed financial advisor before making investment decisions.


















