Hyperliquid Price Prediction: Can Bulls Target $77 After Breakout?


For over a month, HYPE couldn't catch a break. Every bounce ran into a wall, every rally rolled over into a lower high, and the chart kept grinding lower inside a tight descending channel.
That's starting to change. Hyperliquid has pushed above the $56 zone that capped it for weeks, and the question now driving this Hyperliquid price prediction is simple: can buyers actually hold this, or is it another head fake before sellers step back in?
Why Is Hyperliquid Price Moving Today?
HYPE sits near $56.92 right now after poking up to $57.20 earlier in the session.
That back-and-forth is basically the market arguing with itself over whether this breakout deserves respect.
Sentiment has warmed up a bit, but nobody's popping champagne yet. Traders on the derivatives side are leaning long, while momentum is only just starting to turn. A lot could still change depending on how the next daily candle closes.
Hyperliquid Expands HIP-3 Revenue Into HYPE Buybacks
Something new is happening on the fee side of Hyperliquid. For the first time, Trade [XYZ] has used HIP-3 revenue to buy HYPE, which it then used to purchase a new ticker, putting roughly $108K worth of fees into 2,000 HYPE.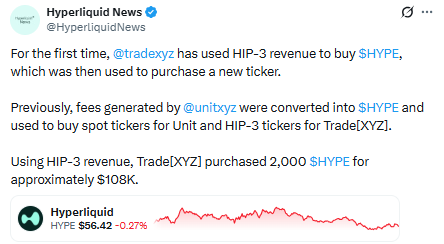
It's a similar playbook to what Unit [XYZ] had already been doing, where fees got converted into HYPE and used to buy spot tickers for Unit and HIP-3 tickers for Trade [XYZ].
It's a small move in dollar terms, but it points to a growing pattern of protocol revenue flowing straight back into HYPE demand.
What Are Futures Traders Signalling?
Open interest on Hyperliquid futures barely flinched during the recent dip toward $51, holding around $2.35 billion as of August 6.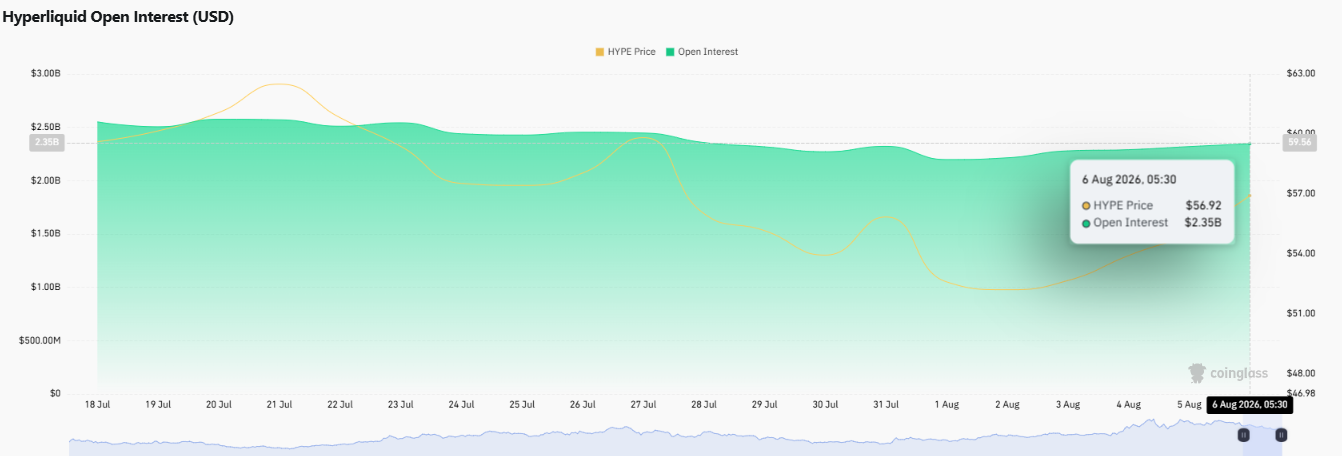
Even with $HYPE trading near $56.92, it was a sign traders were repositioning rather than running for the exits
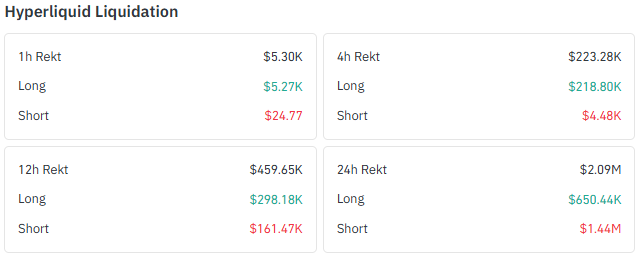
Liquidations paint a more mixed picture depending on the window you look at. Zoom out to 24 hours, and shorts took the bigger hit as the price recovered.
Zoom in to the last 4 hours, and it flips that Longs absorbed most of the damage, which just shows how quickly leverage can swing during a move like this.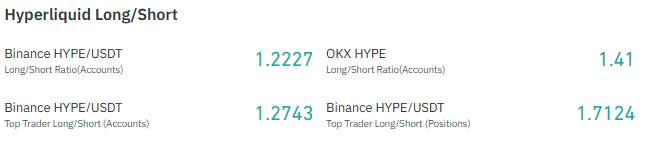
Positioning still skews long overall, with the HYPE/USDT ratio above 1.2 on Binance and above 1.4 on OKX, and top traders even more crowded into longs than that.
It's worth flagging as a risk: if the breakout stalls, that lopsided positioning could unwind fast. Volume-wise, Binance and LBank are doing the heavy lifting, with Hyperliquid's own order book not far behind.
Data source: coinglass
Has HYPE Finally Broken Its Month-Long Downtrend?
The pattern on the TradingView daily chart has been consistent for weeks: a lower high after a lower high, with sellers defending the top of a clean descending channel.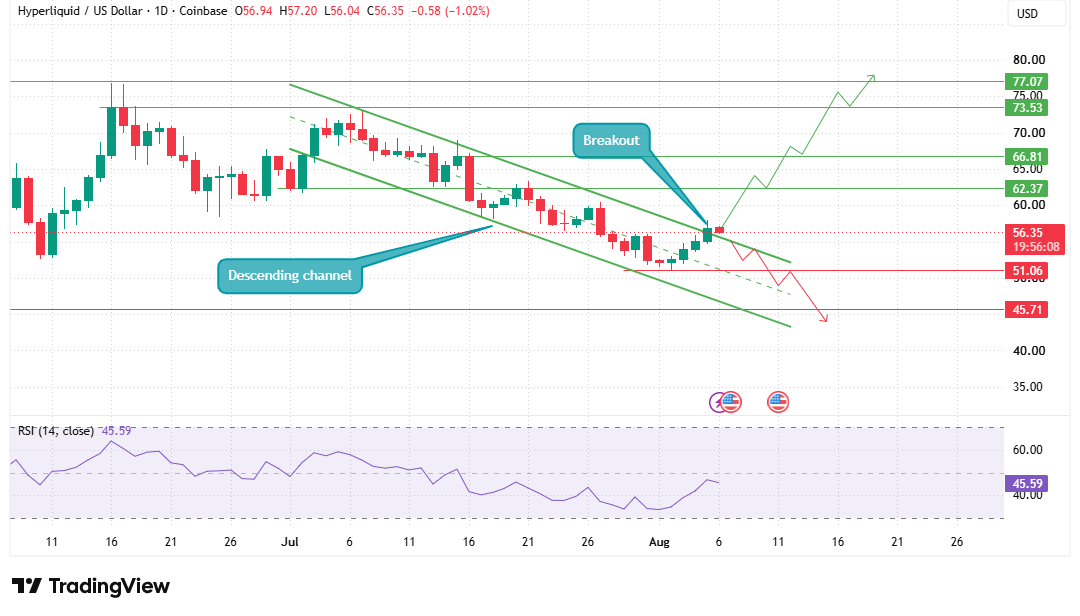
That's the part getting tested right now. Price has broken above the channel's resistance line near $56, which is the first real crack in that structure since it formed.
But let's not get ahead of ourselves. This still reads as an early break, not a confirmed reversal; the candle is sitting right on top of the old boundary rather than clearing it with room to spare.
What would actually make this count: a solid daily close above the zone, ideally on stronger volume than the drift that got it here, and a retest where that old resistance line holds as support instead of caving again.
Skip those two things and this is just another attempt that could still fail like the last few did.
Key Support and Resistance Levels to Watch
$62.37 is the next hurdle on the way up. Get through that, and $66.81 opens up as the next real supply zone, with $73.53 and $77.07 sitting further out as longer-term recovery targets, none of which are likely to hit in a straight line, since each one is a natural spot for traders to take profit.
On the other side, losing the $56 zone again puts $51.06 back on the table, and a break of that hands control to $45.71.
The daily RSI has crawled back up to 45.59 after sitting in weaker territory for a while.
That's improvement, sure, but it's still under the neutral 50 line, which tells you buyers are trying to take control without having actually done it yet.
Push through 50 and this Hyperliquid Price Prediction starts to look a lot more convincing.
HYPE Price Prediction: Bull, Neutral and Bear Scenarios
Scenario | Key Levels |
Bull Case | It holds above $56, clears $62.37, then $66.81, $73.53, and $77.07 come into view |
Neutral Case | Stuck between $51.06 and $62.37 until the RSI can push past 50 |
Bear Case | Drops back under $56, slides inside the old channel, $51.06, and then $45.71 come under pressure |
Price Performance Shows Long-Term Strength Despite Recent Correction
Yes, HYPE has taken a hit on the monthly data, down 20.29% over the past 30 days, but that's coming after a run strong enough to make this look more like a breather than a breakdown.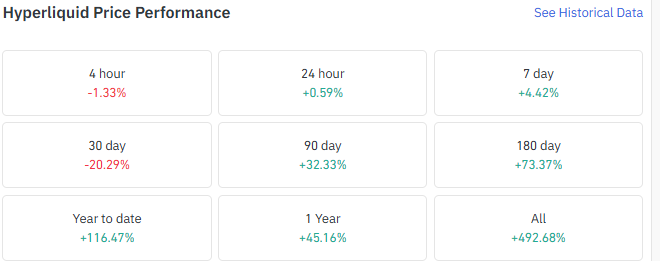
Pull back to 90 days and the token's still up 32.33%. Stretch that to six months and it's sitting on a 73.37% gain, with year-to-date returns at 116.47%.
So while the short-term data looks rough, the bigger picture still tells a bull's story. This reads like a correction inside an uptrend, not the uptrend falling apart.
Zoom out on the fundamentals, and Hyperliquid isn't exactly a small player either.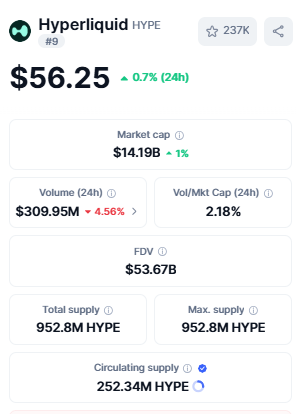
With a $14.19 billion market cap and 252.34 million HYPE currently circulating, it's still one of the more actively traded names out there.
Data source: coinmarketcap
What We're Watching Next
As per the Coingabbar analyst, the breakout is real enough to pay attention to, but it hasn't earned full confidence yet.
Reclaiming $62.37 on top of holding the old channel resistance would go a long way toward making the bullish case for this Hyperliquid Price Prediction stick. Until that happens, it's fair to call this an improving setup rather than a done deal.
Open interest holding steady through the dip is a decent sign; it suggests conviction rather than panic, but with longs already this crowded in the futures market, a failed breakout wouldn't take much to unwind quickly.
Disclaimer:This article is for informational purposes only and should not be considered financial or investment advice. Cryptocurrency markets are highly volatile, and prices can change rapidly. Readers should conduct their own research and consult a licensed financial advisor before making any investment decisions.


















