The Black Bull Price Prediction: Whale Sells $1.5M $ANSEM What Next?


ANSEM is down 24.4% today and over the past week after a top holder began capitulating, selling roughly $1.5 million worth of tokens within a 20-minute window.
This Black Bull Price Prediction covers the whale selling behind this crash, what the chart is showing after the fake breakout, and the levels that matter next.
The Black Bull is a community-driven token, and its recent price action has been heavily influenced by concentrated early-holder activity rather than broad market moves.
The Black Bull Price Prediction: Market Overview
Metric | Value |
Current Price | $0.1570 |
Today's drop | -24% |
24h Range | $0.168 – $0.2537 |
Market Cap | $76.911M |
Fully Diluted Valuation | $185.024M |
24h Trading Volume | $8.626M |
Circulating Supply | 415.659M ANSEM |
Total Supply | 999.943M $ANSEM |
Max Supply | 1B $ANSEM |
Source: Data from CoinGecko
Why ANSEM Is Crashing: Top Holder Capitulation
According to a crypto trader on X, the top ANSEM holder has been capitulating, selling roughly $1.5 million worth of tokens within a 20-minute window. 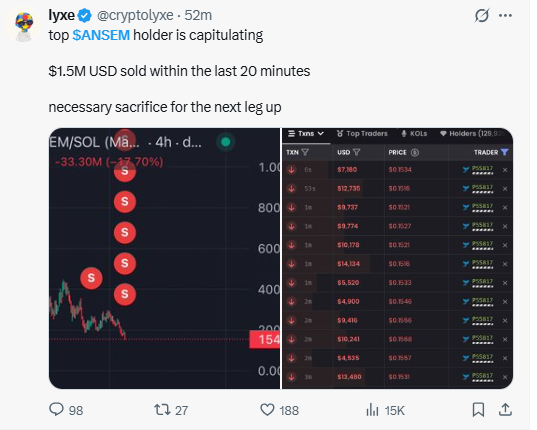
The post frames the move as a "necessary sacrifice for the next leg up," though that's the poster's own interpretation rather than a confirmed outcome.
The accompanying chart shows a rapid sequence of sell transactions from the same trader, coinciding with a 33.30% drop over that window.
Latest Crypto Update: A Related Wallet Sells $515,600 More
Separately, X reported a wallet, ending in S817, selling $515,600 worth of ANSEM, asking whether this marks the bottom. 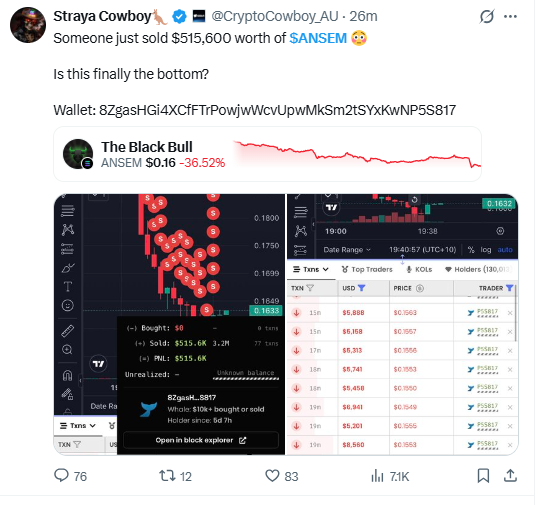
Source: Data from X
On-chain data in that post shows the wallet had held its position for about 6 days and 7 hours before fully exiting.
It's worth noting this $515,600 figure and the $1.5 million figure above come from two separate posts with closely matching wallet tags, but the two amounts should not be read as adding together into a single combined total.
Since it isn't confirmed whether they refer to the exact same transactions or a broader pattern from the same holder over a longer window.
How These Levels Were Read
This analysis uses a 4-hour ANSEM/USDT TradingView chart with the EMA 20, RSI (14), and key support and resistance levels.
As ANSEM is a newly launched token, these are short-term technical observations, and high volatility means the price can change quickly.
The Black Bull Price Prediction: ANSEM Chart Analysis: What Next?
ANSEM had been trading inside a rising channel before briefly breaking above it.
That breakout turned out to be fake, trapping traders who bought into the move, and the price dropped sharply from that failed high soon after.
The same pattern then repeated: another short rise followed by another sharp fall.
Price is now trading at an important level around $0.1570, and the next levels to watch from here are $0.1801 on the upside and $0.1009 on the downside.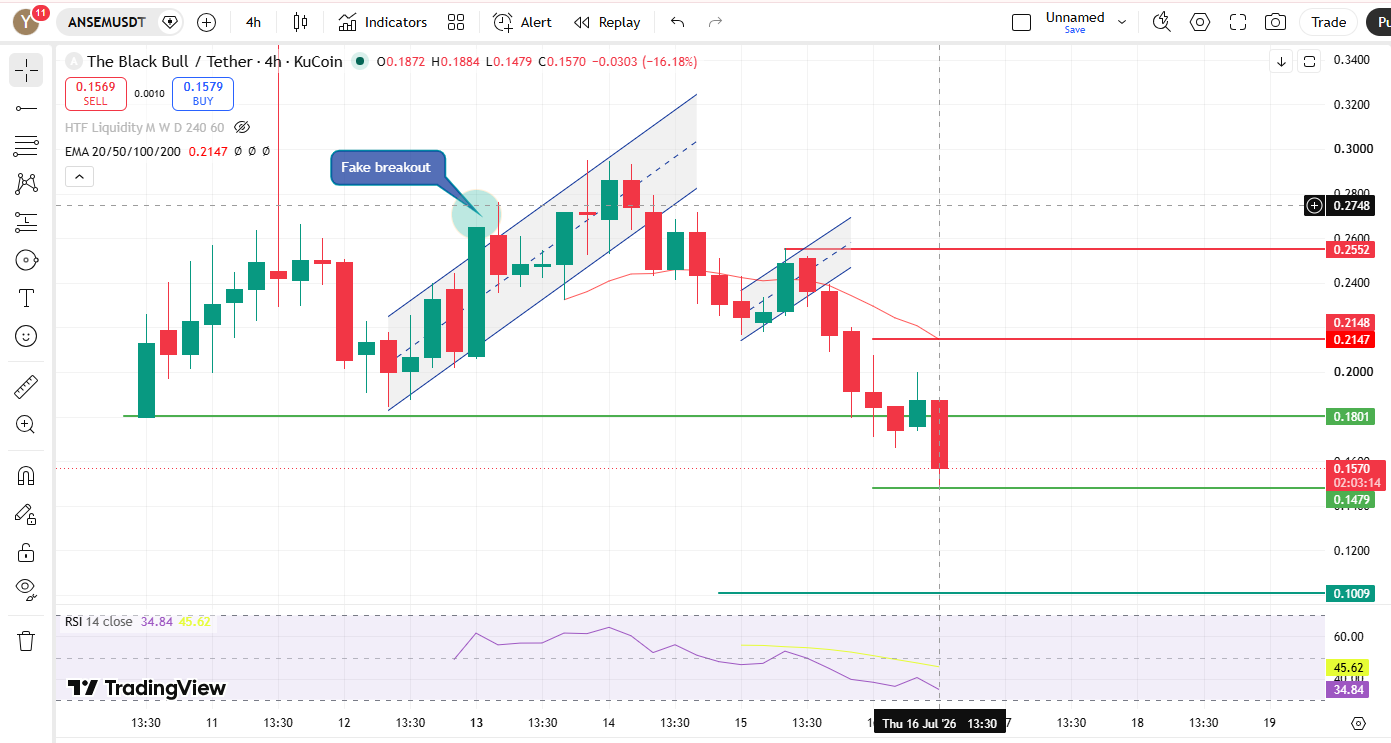
The price is trading well below the EMA 20 ($0.2147), the only EMA currently available on this timeframe, keeping the short-term trend bearish. RSI sits at 34.84, below its 45.62 moving average level, leaning toward oversold without yet being extreme.
The Black Bull Price Prediction: Key Levels
Support | Resistance |
$0.1801 | $0.2148(ema20) |
$0.1009 | $0.2552 |
Two Scenarios to Watch
Bounce Scenario
For a genuine bounce, ANSEM would need to reclaim $0.2147 first, then push through $0.2552.
If the whale selling described above is close to finished, as Lyxe's post suggests, this is the level range that would confirm it. A rejection at $0.2147 (20 ema) would weaken that case quickly.
Breakdown Scenario
Losing $0.1801 would suggest the selling pressure from these large holders is still working through the market.
From there, $0.1009 becomes the next level to watch. A fast reclaim of $0.1801 would call this bearish read into question.
Risk Note
ANSEM is a very new, thinly traded token where a small number of wallets have clearly been able to move price significantly.
That concentration cuts both ways: the same dynamic that caused this crash could also fuel a sharp bounce if buying interest returns.
These levels should be treated as zones to watch, not guarantees, and position sizing should reflect that volatility.
The Black Bull Price Prediction: Expert View
According to CoinGabbar analysts, ANSEM's next move likely depends on whether the reported whale selling is genuinely close to done, as one of the source posts suggests, or whether more large holders are still positioned to exit.
A reclaim of $0.2147 followed by $0.2552 would be the clearest sign buyers are stepping back in. A break below $0.1801 would point toward $0.1009 as the next real test.
Disclaimer: This is a technical read based on current chart structure and should not be treated as financial advice. Crypto markets, and new, thinly traded tokens like ANSEM especially, are highly volatile, and prices can move sharply in either direction with little warning. Always do your own research before making any investment decision.
Also read:
















