Chainlink Price Prediction: Can LINK Extend the Breakout?


$LINK is trading around $8.433 right now, up about 0.68% on the day.
This Chainlink price prediction breaks down how the price finally cleared a resistance zone it had failed at five separate times and what that zone now means for LINK going forward.
With the breakout fresh, the key question is whether this old resistance can now hold as support.
As Per CoinGlass: Chainlink Price Right Now (data as of July 16, 2026)
Metric | Value |
Current Price | $8.433 |
24H Change | +$0.05688 (+0.68%) |
Market Cap | $6.29B |
Futures Volume (24H) | $358.46M |
Spot Volume (24H) | $60.71M |
Open Interest | $449.34M |
Circulating Supply | 748.09M LINK |
Total Supply | 1.00B LINK |
Max Supply | 1.00B LINK |
Source: CoinGlass. These figures move quickly, so treat this as a snapshot rather than a live feed.
Chainlink News Today
As per a Bitcoin professor on X, on-chain data is backing up the case for renewed interest in Chainlink.
The number of wallets holding LINK on Ethereum has climbed to a fresh all-time high of 900,000, with more than 20,000 new wallets added in just the past month, according to Santiment data shared by crypto commentator Bitcoin Professor.
Price has not fully caught up with this wallet growth yet, but a steady rise in holder activity like this is often read as a sign of long-term conviction building underneath the surface.
For any Chainlink price prediction, this kind of adoption trend is worth watching alongside the chart, since it points to accumulation rather than short-term speculation.
Chainlink Liquidation Overview
As per CoinGlass liquidation data, longs took almost all of the pressure on the shorter timeframes, while the 24-hour window shows a more balanced picture with shorts actually taking the bigger hit.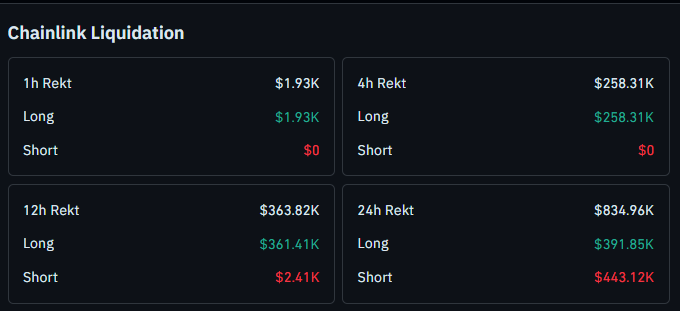
Source: Liquidation data by CoinGlass
The shift from long-heavy liquidations earlier in the day to short-heavy liquidations over the full 24-hour window fits with the story on the chart: sellers were in control for a while, then got caught out once price finally broke free of resistance.
Chainlink Technical Analysis: Five Rejections, Then a Clean Breakout
On the 1-hour chart, $LINK spent a long stretch getting rejected from the same resistance zone, and it happened five separate times before price finally broke through. 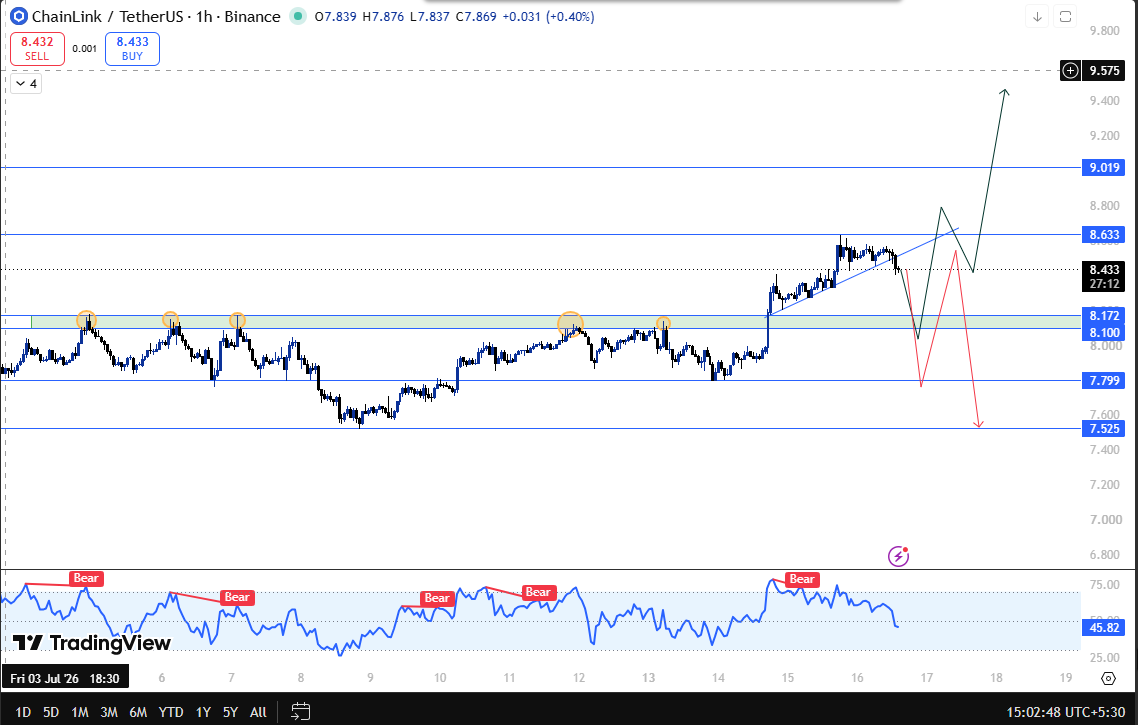
The first three rejections each led to a lower low, showing sellers firmly defending that ceiling and pushing price down harder each time.
By the fourth attempt, the selling pressure at resistance had clearly weakened, and even though a fifth wave of selling showed up after that, it wasn't enough to hold price down for long.
What happened next is the key part of this setup.
The price dipped just below the fourth low, sweeping out the liquidity resting there, and then reversed hard with an instant breakout above the resistance zone.
This kind of liquidity grab right before a breakout is often a sign that the last of the sellers got flushed out before buyers took over.
With that move, the old resistance zone between $8.100 and $8.172 now becomes a flip area.
This area should work as support going forward, and any pullback into this zone could be where fresh buying interest shows up.
On the upside, the next resistance levels to watch are $8.633, followed by $9.019, and a stronger extended move could bring more upper levels into play.
On the downside, if the flip zone fails to hold and price breaks down instead, the first support to watch is $7.799, and a direct move below that could send price toward the next support at $7.525.
$LINK Support and Resistance Levels
Level Type | Price |
Resistance | $9.019 |
Resistance | $8.633 |
Flip Zone / Support | $8.100-$8.172 |
Support | $7.799 |
Support | $7.525 |
Risk and Reward: A Balanced Look
Factor | Bull Case | Bear Case |
Flip Zone Support | Holds and buying steps in, opening a path to $8.633 and $9.019 | Fails to hold, price slides back toward $7.799 |
$7.799 Support | Holds if the flip zone gives way, keeping the broader structure intact | Breaks down directly, extending the fall toward $7.525 |
This breakdown combines the hourly chart structure with current liquidation data and on-chain wallet activity.
It reflects short-term technical conditions only and is not a broader investment outlook.
Invalidation Level
The bullish case for this Chainlink price prediction depends on the flip zone holding as support.
If LINK closes directly below $7.799, that would invalidate the flip zone thesis, since it would mean the price failed to hold the breakout level before even reaching the $7.799 support.
In that case, LINK would likely need to test lower support levels before another recovery attempt becomes realistic.
Expert View
Traders watching LINK on the lower timeframe see the liquidity grab below the fourth low as the turning point in this setup, since sweeping out that liquidity right before the breakout is a classic sign of exhausted sellers rather than a fakeout.
The shift toward short-heavy liquidations over the 24-hour window supports this, showing that sellers who stayed positioned against the breakout ended up on the wrong side of the move.
Rising wallet activity on Ethereum adds a longer-term angle to this Chainlink price prediction, suggesting that holder conviction has been building even while the price stayed range-bound.
A hold above the flip zone keeps $8.633, $9.019, and $9.575 in focus, while a close below $7.999 would shift attention back down to the $7.799 and $7.525 support levels.
Disclaimer: This article is for informational purposes only and should not be considered financial advice. Cryptocurrency markets are highly volatile, and price predictions are not guaranteed. Please do your own research before making any investment decisions.
















