BNB Price Prediction: Grayscale Win Fades, When Will BNB Rally?


The token has spent the past few days caught between a fresh institutional headline and a chart pattern traders have been watching since late July.
This BNB price prediction looks at what changed on August 7, 2026, when a new fund allocation update collided with a technical setup still working itself out on the daily chart.
BNB traded near $586 on August 7, 2026, above the $571.95 support after its 30 July breakout from a symmetric triangle. A 20/50-day EMA bullish crossover is forming, and Grayscale's Smart Contract Fund now holds BNB as its top asset, pending a break above $601.90.
Key Takeaways
-
Grayscale's Smart Contract Fund now holds BNB at 30.6%, ahead of Ether and Solana.
-
BNB traded at $586.49 on August 7, 2026, down 1.36%, on falling volume.
-
Price defends the 30 July breakout above $571.95, with an EMA crossover still forming.
-
Long positions dominate liquidations, adding risk near $601.90 resistance.
What Did Grayscale Just Confirm About Its Holding?
BNB Chain's official X account confirmed that the token now makes up the largest portion, around 31%, of Grayscale's Smart Contract Fund.

(Source: BNB Chain official X account, posted August 6, 2026)
Wu Blockchain added detail on the same update, reporting that Grayscale added the asset to the fund during its second quarter rebalancing, giving it a 30.6% weighting ahead of Ether at 29.47% and Solana at 29.15%.

(Source: Wu Blockchain official X account, posted August 6, 2026)
How Did the Rest of Grayscale's Funds Move?
The same rebalancing update noted that Grayscale's DeFi Fund trimmed its Uniswap exposure, though UNI remained the largest holding at 34.16%. Its Decentralized AI Fund reduced NEAR, which still held the top position at 31.35%.
This BNB price prediction treats the smart contract fund shift as the key data point, since it directly involves the token overtaking two major layer-one assets inside a tracked institutional fund.
These figures are self-reported by Grayscale through its own channels and have not been independently audited beyond the source posts cited above.
How Is Binance Coin Trading Right Now?
As per live market data checked by CoinMarketCap on August 7, 2026, the token traded at $586.49, down 1.36% over 24 hours.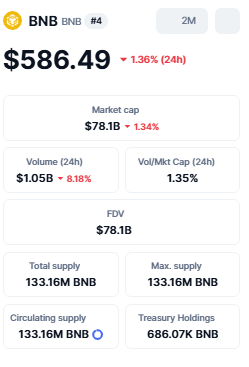
Market capitalization stood at $78.1B, also down 1.34% for the day, while 24-hour trading volume came in at $1.05B, a steeper 8.18% drop that put the volume-to-market-cap ratio at 1.35%.
Fully diluted valuation matched market cap at $78.1B, since total supply, max supply, and circulating supply all sit at the same 133.16M figure. Treasury holdings were listed separately at 686.07K coins.
The volume decline alongside a modest price dip suggests the pullback from recent highs has come on lighter participation rather than a rush of new selling.
What Does the Long Short Ratio Show?
Derivatives data checked the same day on Coinglass showed a long heavy positioning skew across major venues. Binance's spot pair long/short ratio by accounts stood at 2.4294, while OKX showed a similar 2.45 ratio.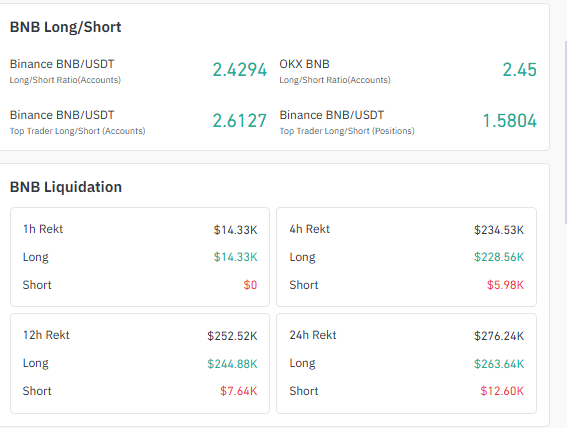
Among Binance's top traders specifically, the account-based long-short ratio was higher at 2.6127, though the position-based ratio was lower at 1.5804, indicating top traders held a less lopsided book than smaller accounts.
What Does the 24-Hour Liquidation Data Show?
Liquidation data leaned heavily toward longs getting caught out. Over the past hour, $14.33K in long positions were liquidated, with no short liquidations recorded.
The 4-hour window showed $234.53K in total liquidations, with $228.56K coming from longs against just $5.98K from shorts. Across 24 hours, total liquidations reached $276.24K, split between $263.64K in longs and $12.60K in shorts.
This pattern points to leveraged long positions absorbing most of the recent volatility, a detail worth watching if bullish forecasts lean on the Grayscale news alone.
What Does the Daily Chart Show Leading Into August 7?
A daily chart checked on TradingView at 12:55 PM IST on August 7, 2026, traced the structure back to a June spike toward the $660 region, after which the 20 and 50-day exponential moving averages formed a bearish crossover.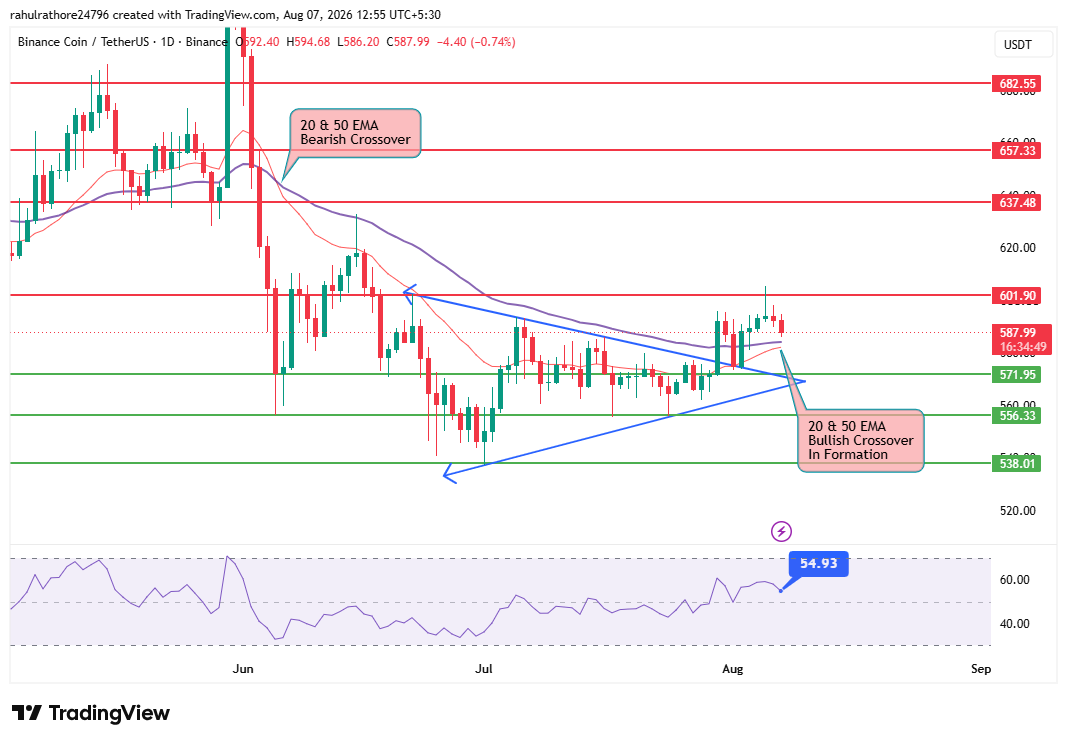
That crossover preceded a sharp selloff that pulled price down to the $538 area by early July.
From that low, a symmetric triangle pattern formed through July, with higher lows off the $538 to $556 zone, repeatedly testing a descending resistance line near $601.90.
What Happened After the 30 July Breakout?
On 30 July, the price broke above that descending resistance line and then pushed up to test $601.90 directly.
Since then, price has held in the $587 to $588 zone, above the triangle's breakout area, even after failing to clear $601.90 outright.
The same daily chart, checked at 12:55 PM IST on August 7, showed the day's candle opening at $592.40, a high of $594.68, a low of $586.20, and a close near $587.99.
A 20- and 50-day EMA bullish crossover is currently forming in this consolidation zone, the mirror image of the bearish crossover from the June top.
The RSI read 54.93 at the time of the chart, in neutral to mildly bullish territory and well above the July lows.
Resistance sits at $601.90, then $637.48, $657.33, and $682.55. Support sits at $571.95, then $556.33 and $538.01.
Will Price Rally From Here or Reverse Again?
The setup is no longer a breakout waiting to happen; it already happened on 30 July, and the price is now defending that breakout rather than building toward it.
Holding above $571.95, the triangle's former resistance turned support, keeps the reversal thesis alive, especially with the EMA crossover still forming and RSI holding a constructive middle ground.
The long heavy liquidation data adds a caution flag.
A market already skewed toward longs has less room to absorb a failed break above $601.90 without triggering another round of forced selling, even if the Grayscale allocation news reads as a bullish long-term demand signal.
BNB Price Prediction: What Do the Scenarios Suggest?
Based on the current chart structure and today's fund and derivatives data, three scenarios stand out for where this forecast could head next.
Methodology
These BNB price prediction scenarios come from three inputs checked on August 7, 2026: daily chart structure (EMA, RSI, support/resistance), current long/short and liquidation data, and the confirmed Grayscale allocation update.
Ranges assume today's volume and positioning broadly hold.
These ranges are scenario estimates built on the current technical structure and today's data points, not guarantees, and will shift as new price and volume data comes in.
What Do Analysts Make of the BNB Price Prediction Right Now?
As per CoinGabbar analysts , the combination of a confirmed institutional allocation shift and a breakout retest chart pattern gives this BNB price prediction more to work with than either data point alone.
The Grayscale update strengthens the demand case over a longer horizon, while the daily chart's EMA crossover in formation and RSI near 55 suggest short-term momentum is still undecided rather than confirmed bullish.
The long-heavy liquidation skew remains the detail worth tracking closely, since a market this tilted toward longs tends to see sharper moves once $601.90 or $571.95 actually breaks in either direction.
CoinGabbar has no sponsorship or affiliate arrangement with BNB Chain, Grayscale, or any exchange referenced in this article. Coverage relies on official X accounts and publicly available market and derivatives data.
Glossary
-
EMA: a trend indicator weighting recent prices more heavily, used here in 20/50-day pairs.
-
RSI: a 0-100 momentum reading, above 70 overbought, below 30 oversold.
-
Long/Short Ratio: the share of traders betting on a price rise versus a fall.
-
Liquidation: forced closure of a leveraged position when losses breach margin.
Disclaimer: This article is for informational purposes only and does not constitute financial or investment advice. All price, fund allocation, and derivatives figures are based on official social media posts and public market data, checked as of August 7, 2026, and are not independently verified. Chart levels reflect technical analysis, not guaranteed outcomes. Cryptocurrency investments carry significant risk, including total loss of capital.
















