Chainlink Price Prediction: Can $LINK Enter a New Bullish Era?


LINK's been squeezing tighter by the candle on the shorter chart, and setups like that usually don't stay quiet for long.
Right now it's just above $8.20, up a touch today. Break out with real volume behind it, and this Chainlink price prediction leans bullish fast.
Fail that breakout, though, and the price probably drifts back down before trying again.
$LINK Live Market Data
LINK is currently trading at $8.21, up 0.3% on the day, ranging between $8.06 and $8.33. 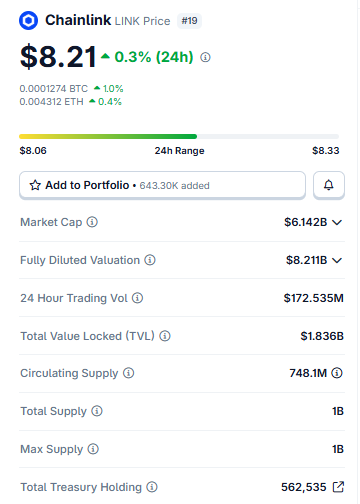
Source: $LINK Market Cap Data Taken From Coingecko, data as of Aug 07, 2026. Figures may vary slightly across other tracking websites.
Market cap sits at $6.142B, and fully diluted value isn't far off at $8.211B, since circulating supply of 748.1M is closing in on the full 1B cap.
Volume over the past 24 hours hit $172.535M, with $1.836B locked into the protocol itself.
Liquidation Snapshot
Nothing too dramatic in the liquidation numbers right now. $90.91K in longs got wiped over 24 hours versus $33.00K in shorts, small totals either way for LINK. 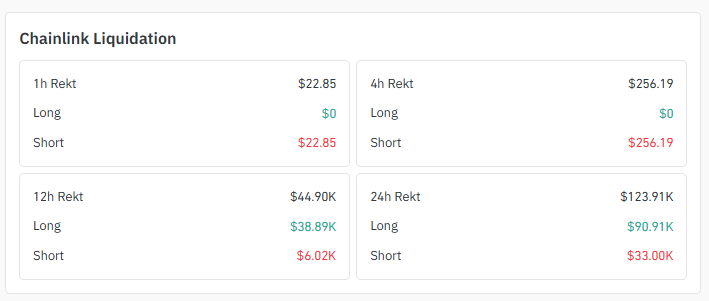
Source: Liquidation Data Taken From Coinglass .
Worth a mention though, shorts took almost the entire hit in the last hour and the last 4 hours, meaning the recent bounce caught a handful of bears leaning the wrong way.
Exchange Volume
Binance's out front by a mile, $106.24M in 24-hour futures turnover, more than triple whoever's second. 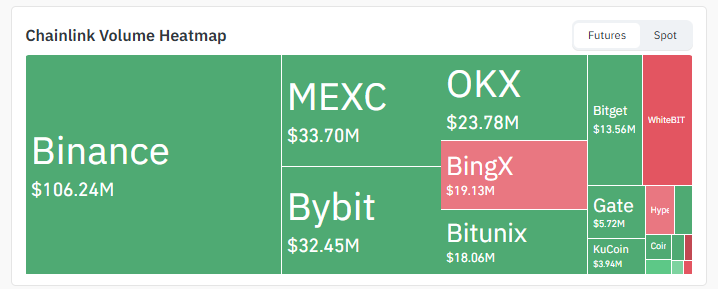
Source: Volume Heatmap Data Taken From Coinglass.
MEXC's next at $33.70M, Bybit at $32.45M, OKX at $23.78M. BingX, Bitunix, and Bitget fill out the rest somewhere between $13M and $19M each.
Spread out like that, it's not one exchange carrying the whole number; demand's fairly broad here.
$LINK News Today
There's a bigger story sitting under the chart too. 
Source: Data Taken From @BSCNews , X Account.
Chainlink's cross-chain infrastructure reportedly underpins something like 70% of all wrapped Bitcoin out there right now, with names like BitGo and Coinbase leaning on its systems for over $13.5 billion worth of wrapped BTC alone.
That kind of quiet infrastructure win doesn't always move the price the same day it drops, but it does add real weight underneath this Chainlink price prediction over the long run.
Key Takeaways
-
LINK's at $8.227, up 0.48% today, boxed inside a Symmetrical pattern on the 4H chart.
-
A five-point setup on that same chart lines up with $8.457 first and $8.827 after if the price breaks upward.
-
Break down instead, and $8,001 shows up first, $7,801 after that.
-
Zoom out to the daily and LINK's riding an ascending channel, $9.313 and $10.043 sitting above, $7.639 and $6.999 below.
-
Chainlink's infrastructure reportedly sits behind 70% of all wrapped Bitcoin now, a quiet but genuinely big deal.
4H Chart: Tight Triangle
Look at the 4H chart and LINK's stuck inside a symmetrical triangle, swings getting smaller with every bounce, the kind of coil that tends to snap eventually. 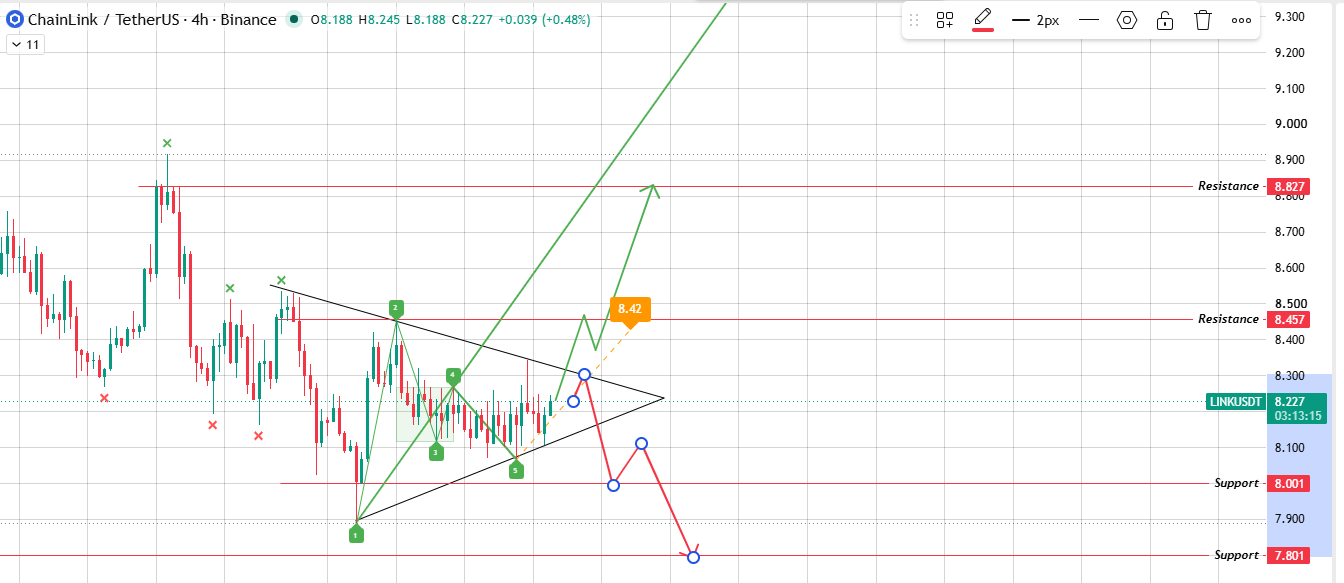
Source: Chart Taken From TradingView.
There's a wolfe wave five-point pattern layered on top of it too, the sort chart watchers use to guess where price ends up after the move, and it happens to point the same direction as the triangle itself, up.
Clear the top with volume, and $8.457 comes first, $8.827 if the move actually carries. Break down instead, and $8.001 shows up quick, maybe $7.801 if sellers grab hold.
1D Chart: Ascending Channel
Pull back to the daily, and LINK's been climbing steadily for a while now, riding in an ascending channel with two parallel lines both angled up. 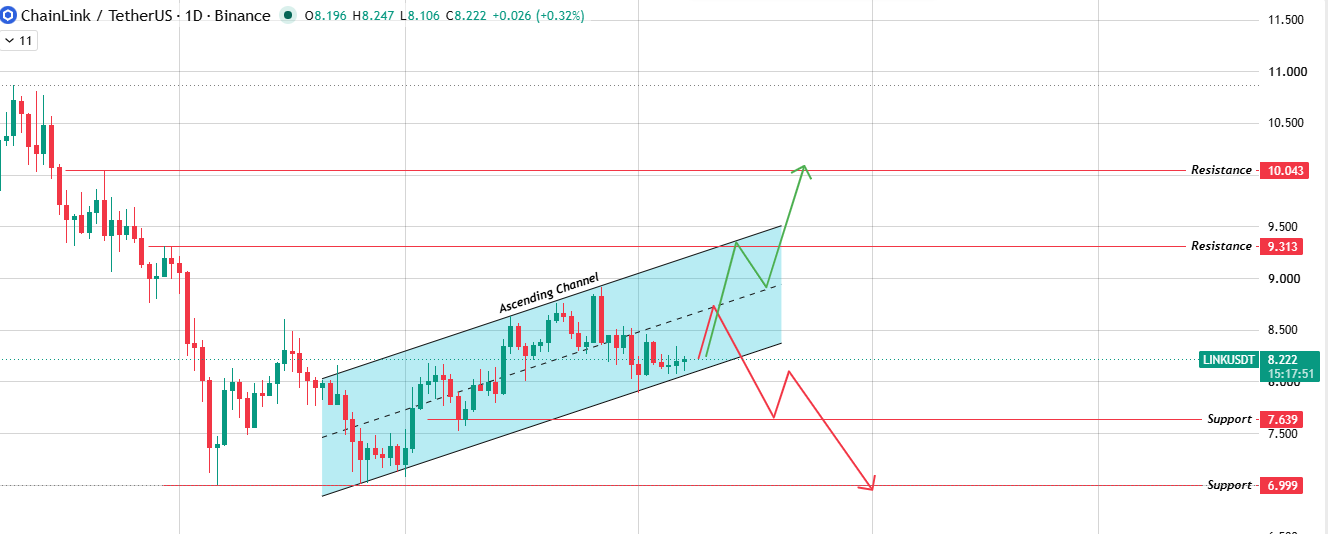
Source: Chart Taken From TradingView.
Clear the top of it and $9.313 opens up, with $10.043 further out if this trend has real staying power.
Break the bottom instead, and $7.639 becomes the level everyone's watching, $6.999 underneath if things really sour.
Bull, Base, and Bear Scenarios
Risks
$LINK doesn't trade in a vacuum.
Let BTC dominance shift hard enough, and it could easily override whatever this triangle is signaling.
Triangle breakouts fail plenty too, so waiting for actual volume before trusting the first move through either line is the smarter play.
Glossary
Symmetrical Triangle: Price swings get tighter and tighter here until something finally gives, usually a sharp move either way.
Ascending Channel: Two rising lines running side by side, price bouncing between them, a straightforward sign of a steady uptrend.
Wolfe Wave: Traders spot five specific swing points and use them to guess roughly where price lands after the next breakout.
Methodology: Levels in this Chainlink price prediction come straight from TradingView chart analysis on the 4H and 1D timeframes, alongside liquidation, volume, and market data pulled at the time of writing. Numbers can shift as the market does.
Disclaimer: This article is for informational purposes only and does not constitute financial advice. Cryptocurrency markets are highly volatile and speculative. Always do independent research and speak with a licensed financial advisor before making investment decisions.
















