BUILDon Price Prediction: $B, Can Whales Extend the 59% Rally?


Something odd happened in the altcoin corner of the market this week, and most traders almost missed it. A low-cap token quietly doubled the attention it got, and now everyone's asking the same question. Is this the start of something bigger, or just another quick spike that fades by the weekend?
Why Is Everyone Suddenly Talking About This Token Again
BUILDon price prediction talk picked up fast after the token posted one of its sharpest moves in weeks. It's not every day a mid-sized altcoin jumps this hard while the wider market barely moves.
Traders noticed the volume first. Then came the chart. Basically, the setup went from sleepy to loud within a single session.
We pulled up the daily numbers, and the first thing that stood out was how thin the float still is compared to the size of the move. That combination tends to grab attention fast.
So what's actually driving this jump, and does it have legs? That's the part worth digging into.
BUILDon Coin Overview
| Field | Detail |
|---|---|
| Coin Name | BUILDon |
| Ticker Symbol | B |
| Blockchain | BNB Smart Chain (BEP-20) |
| Today High | $0.26518 |
| Today Low | $0.23377 |
| RSI Level | 83.02 |
| Token Type | Utility Token |
| Token Category | Layer 2 / Ecosystem Token |
| Market Cap | $257.65M |
| 24H Trading Volume | $41.1M |
| Circulating Supply | 1B B |
| 24H Change | +58.99% |
Source: Data by CoinMarketCap
What Exactly Is This Coin and Why It Exists
BUILDon runs on the BNB Smart Chain and is built as a utility token tied to an on-chain ecosystem project. It's still fairly young, with a total supply capped near one billion tokens.
People started paying attention once holder counts crossed the 70K mark.
Why This Coin Matters Now Beyond Just the Pump
This isn't purely a hype-driven spike. Sector rotation into low-cap altcoins has been picking up, and BUILDon happened to be one of the tokens catching that flow first.
There's also a real holder base behind it. Whale wallets make up just over 5% of holders, but they're clearly active right now, a pattern showing up across several crypto airdrops and community reward campaigns tied to the same ecosystem.
BUILDon Liquidation Data Shows Heavy Short Squeeze Pressure
The last 24 hours tell a clear story. Total liquidations hit $558.50K, and shorts took the bigger hit at $429.22K against $129.28K in longs.
Even the 1-hour window shows shorts getting squeezed, with $13.80K in short liquidations against $34.37K on longs, meaning late longs got shaken out too as volatility spiked.
Source: Liquidation data by CoinGlass
BUILDon Fundamental Analysis: Supply, Holders, and Concentration
Here's the thing about BUILDon's holder structure: whale concentration sits at 79.35%, and the Gini distribution score of 0.9436 confirms supply is heavily concentrated among a small group.
Only three wallets hold at least 1% of the total supply each. Turns out, top 100 wallets control just 18.69%, which is lower than the whale tier number suggests, pointing to a few very large holders rather than a broad whale base.
Shrimp holders, meaning wallets with tiny balances, make up 84.49% of all holders but control under 0.01% of supply. That's a typical distribution pattern for a coin still early in its holder growth curve.
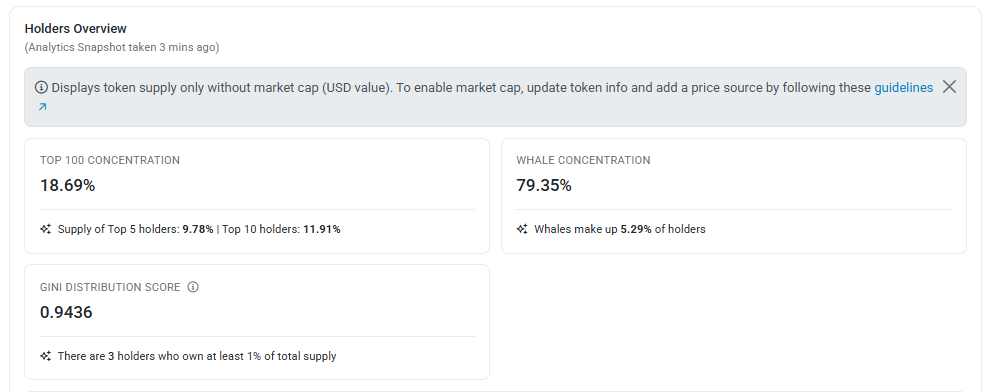
Source: Holder data by BscScan
BUILDon Technical Price Analysis After the Breakout Rally
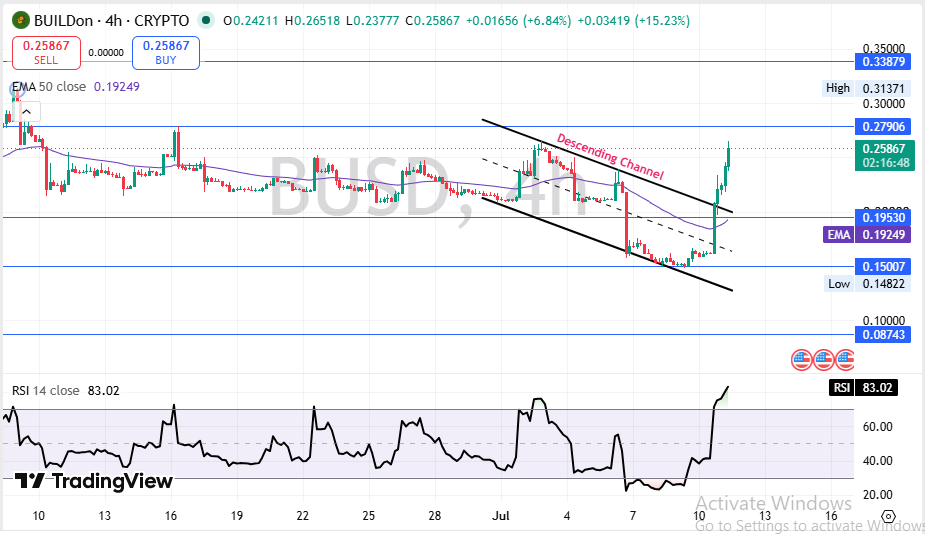
BUILDon is trading at $0.25867 on the 4-hour chart, and the reason behind the move is straightforward: the token broke out of a multi-week descending channel with strong volume behind it.
Source: Charting by TradingView
Price is now sitting well above the 50 EMA near $0.19249, which had been acting as dynamic resistance during the downtrend. That flip from resistance to potential support matters.
RSI at 83.02 is deep in overbought territory. Fast move, fast reading. It doesn't mean an immediate reversal, but it does raise the odds of a cooling-off period before the next leg.
Immediate resistance sits at $0.27906, with the next level up at $0.31371 and then $0.33879.
On the downside, support lines up at $0.19530, then $0.15007, with $0.08743 as the deeper cushion.
A close below $0.15007 would invalidate the current bullish structure entirely. Watch that level closely.
BUILDon Volume Heatmap Confirms Where the Real Action Is
Binance is doing the heavy lifting here with $131.36M in volume, dwarfing every other venue. LBank follows at $31.40M, then Bybit at $25.87M.
MEXC, Bitget, Bitunix, and Gate round out the rest with smaller but still meaningful contributions, showing this kind of volume spread across top crypto exchanges rather than just one venue.
Source: Volume heatmap by CoinGlass
How BUILDon Stacks Up Against Other Altcoins Right Now
Compared to broader altcoin market trends, BUILDon's move stands out for its size relative to market cap. Most large-cap names haven't seen anything close to this kind of daily swing.
Short-Term BUILDon Price Prediction for the Coming Days
The next few days will likely decide whether this breakout holds or fades back into the old range. Momentum is strong but stretched.
| Timeframe | Bearish Target | Base Target | Bullish Target | Key Trigger |
|---|---|---|---|---|
| 24 Hours | $0.2200 | $0.2586 | $0.2790 | RSI cooling off without heavy selling |
| 3–7 Days | $0.1950 | $0.2450 | $0.3137 | Volume holding above $30M daily |
| 2–4 Weeks | $0.1500 | $0.2200 | $0.3200 | Follow-through buying from new holders |
Watch the volume more than the price over the next week.
Long-Term BUILDon Price Prediction Through Next Year
Zooming out, the long-term case depends on whether this breakout turns into sustained accumulation or just gets sold into by early holders.
| Timeframe | Bearish Target | Base Target | Bullish Target | Catalyst Needed |
|---|---|---|---|---|
| 3 Months | $0.1200 | $0.2000 | $0.3200 | Continued exchange listings and volume growth |
| 6 Months | $0.0900 | $0.1800 | $0.3800 | Ecosystem expansion and new partnerships |
| End of Year | $0.0800 | $0.2100 | $0.4500 | Broader altcoin season taking hold |
| 2027 Outlook | $0.0700 | $0.2500 | $0.6000 | Sustained BNB Chain ecosystem growth |
The long-term case is speculative right now, not proven yet. It needs more than one good week to become believable.
Three Price Scenarios Traders Should Be Watching
Worst Case: A sharp reversal below $0.1953 triggers panic selling from short-term holders who bought the top. This would likely pull price back toward the $0.15 invalidation zone fast.
Base Case: Price consolidates between $0.20 and $0.28 as the market digests the move. Volume gradually normalizes while the chart builds a new base.
Best Case: Buyers keep stepping in above the 50 EMA and push through $0.31371 resistance. That would open the door toward the $0.33879 zone and beyond.
| Scenario | Price Range | What Triggers It |
|---|---|---|
| Worst Case | $0.08 - $0.15 | Breakdown below the invalidation level with heavy long liquidations. |
| Base Case | $0.20 - $0.28 | Sideways consolidation as bullish momentum cools. |
| Best Case | $0.31 - $0.40 | Breakout continuation supported by sustained trading volume. |
Key BUILDon Price Levels Every Trader Should Watch
Resistance zone: $0.27906 first, then $0.31371 above it; both need strong volume to break cleanly.
Support zone: $0.19530 is the first cushion, with the 50 EMA near $0.19249 reinforcing it.
Invalidation zone: A close below $0.15007 breaks the bullish structure and shifts the outlook bearish.
Analyst View and Final Thoughts on BUILDon
The chart setup right now favors buyers, but an RSI above 80 means this rally is running hot. That's not a reason to panic, just a reason to size positions carefully.
A weekly close above the 50 EMA would confirm the breakout has real staying power, not just a one-day squeeze. That's the level to track going into next week.
Beyond the chart, keep an eye on overall risk appetite tied to the Bitcoin price outlook, since low cap altcoins like this one tend to follow Bitcoin's lead when volatility picks up.
Broader sentiment matters too. The current Fear and Greed Index reading gives useful context on whether risk appetite across the market supports more upside.
The most important level to watch remains $0.19530. Hold above it, and the bulls stay in charge.
Disclaimer: This article is for educational purposes only and does not constitute financial advice. Crypto markets are volatile. Consult your investment advisor before making any investment decision.

















