Capricorn APR Price Prediction: What Is the Buyback Hiding?


The Coin That Rebranded and Then Ripped
Something strange happened in a market that had gone mostly quiet, and it centers on Capricorn APR price action that caught a lot of traders off guard. This is the token formerly known as aPriori, and it just reminded everyone why small caps can move faster than headlines can keep up with.
A rebrand alone rarely moves a chart this hard. So what actually flipped the switch here?
There was a buyback. There was a tokenomics reveal. And there was a wave of shorts that got caught leaning the wrong way at exactly the wrong moment.
Turns out, the combination hit at once, not in stages, and that timing matters more than people realize. We are not talking about a slow grind higher either. This looks like a squeeze layered on top of real news, and that combination rarely fades quietly. Want to know which part of this move actually holds up under scrutiny?
Key Takeaways
Capricorn APR price is up sharply on the day, driven by a confirmed 5.3% supply buyback.
The rally coincided with a fresh tokenomics disclosure and a heavy short liquidation event.
Resistance sits near $0.681, $0.814, and $0.980; support sits near $0.148 and $0.063.
Whale concentration is extreme, with one wallet holding roughly 49% of the circulating supply.
RSI near 70 signals an overbought short-term chart, even with strong underlying news.
Why Is Capricorn APR Price Moving Today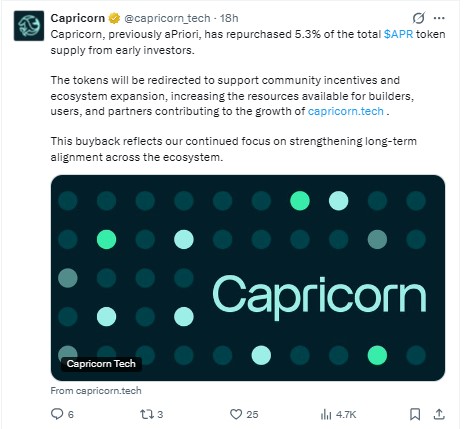
The confirmed catalyst is a buyback. Capricorn, previously aPriori, announced it had repurchased 5.3% of the total APR token supply from early investors, redirecting those tokens toward community incentives and ecosystem growth, according to a post from the official project account.

That news landed alongside a separate disclosure. Tokenomics.com published a full breakdown of APR allocation, vesting, unlocks, and valuation, which gave the market fresh data to react to within hours, per the tokenomics data release.
But announcements alone rarely explain a move this violent. Positioning did the rest.
Derivatives data shows $12.65 million in total liquidations over 24 hours, and short positions took the bulk of it at $8.79 million against $3.85 million on longs, based on liquidation tracking. Traders betting against APR got forced out as price ripped higher, and that forced buying likely amplified the initial reaction to the buyback news.
Where Is Capricorn APR Price Right Now
As of 14:14 UTC on August 13, 2026, APR traded near $0.4469, up roughly 115% over 24 hours, with market cap around $124.15 million, per CoinMarketCap data. Volume over the same window hit $148.14 million, a jump of more than 5,500%.
That is a volume-to-market-cap ratio above 116%, which is unusually high. It tells us trading activity briefly outpaced the entire market cap in a single day.
Price is still well below the all-time high of $0.735 set in October 2025, sitting roughly 39% under that peak. It also sits far above the February 2026 low near $0.0645, up more than 600% from that bottom.
Capricorn APR Technical Chart Analysis
The daily chart shows a clean breakout from a months-long consolidation range that had capped price between roughly $0.148 and $0.30, and that range held from May through early August before finally giving way. 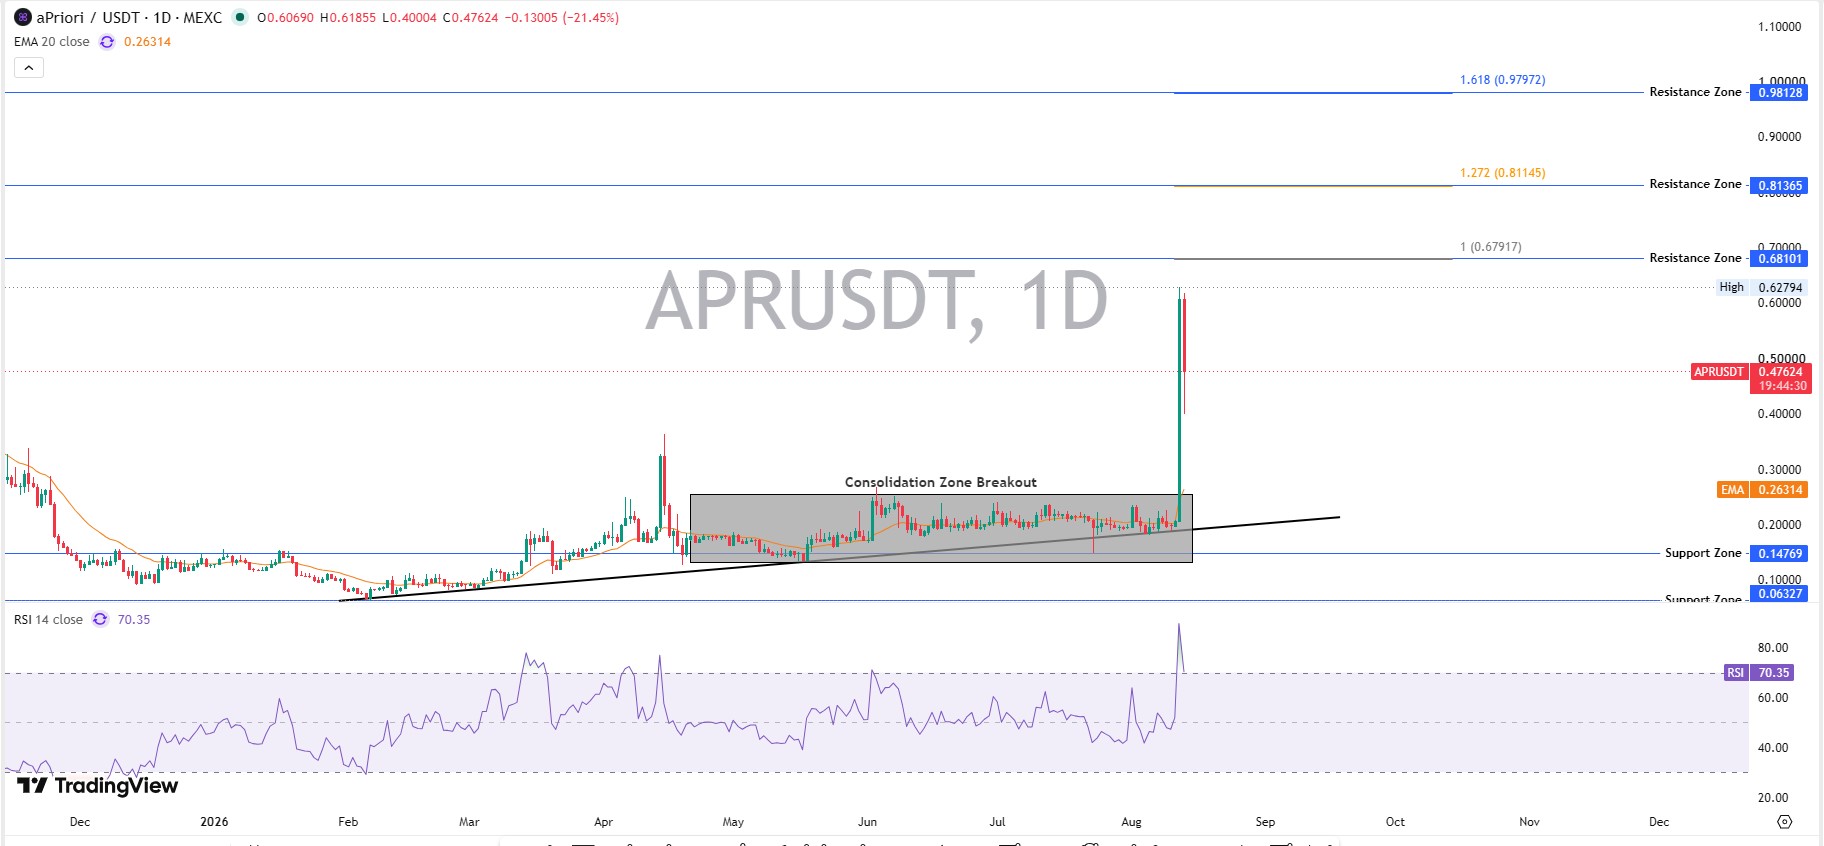
RSI at 70.35 is firmly in overbought territory, and price now trades far above the 20-day EMA near $0.263. That gap between price and EMA rarely holds without a pullback or a pause first, so a short-term cooldown wouldn't be surprising even if the broader trend stays intact.
Zooming out, the breakout candle also cleared a rising trendline that had guided price, and that's the kind of structural break that tends to matter more than a single green candle.
Fibonacci extensions place the next resistance zones at $0.681, $0.814 and $0.980, while the broader support structure still rests near $0.148, with a deeper floor around $0.063.
If momentum holds through the coming weeks, the long-term structure favors higher highs, not a return to range-bound trading. But volume needs to stay elevated for that to play out, and a fade back under the old range would put the whole breakout thesis in question.
Whale Concentration Is the Real Risk Behind Capricorn APR Price
Here's the thing: on-chain data tells a different story than exchange-listed holder counts suggest. CoinMarketCap shows over 15,300 holders, but Etherscan's on-chain data shows just 577 wallets actually holding the ERC-20 token directly.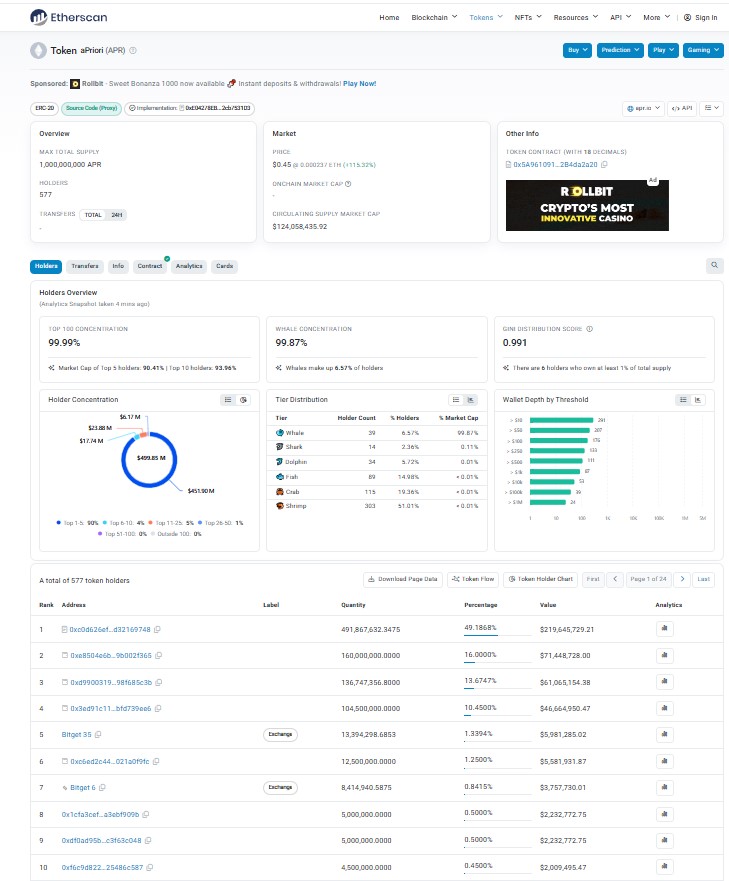
One wallet alone controls close to 49% of total supply, worth roughly $219 million at current prices. The Gini distribution score sits at 0.991, and whales make up just 6.57% of holders while owning 99.87% of tokens.
This is not automatically bearish. But it does mean a handful of wallets can move this market more than any indicator can.
This kind of concentration shows up across many low-cap altcoin launches, not just this one, and it's worth checking for upcoming exchange listing news before assuming liquidity will hold steady.
What Could Happen Next for Capricorn APR Price Prediction
Scenario | Target Range | Probability | Key Trigger | Invalidation |
Bull | $0.68 to $0.81 | 30% | Sustained volume, no whale dump | Break below $0.30 |
Base | $0.30 to $0.50 | 45% | Cooling RSI, range-bound trading | Break below $0.148 |
Bear | $0.15 to $0.22 | 25% | Whale distribution, fading volume | Reclaim above $0.50 |
We built these ranges from the Fibonacci resistance zones, the current support shelf, and the liquidation data pulled from Coinglass earlier today. None of this is financial advice, and every level here can shift fast given how thin the holder base actually is.
What Could Invalidate This Forecast
A drop below the $0.148 support zone would undo most of the bullish structure built since May. And any large transfer from the top wallet toward an exchange would be an immediate red flag worth watching closely on Etherscan's holder page.
Liquidity also remains thin relative to market cap, with a liquidity-to-market-cap ratio near 0.72%. That is not much cushion if sentiment turns. Keep an eye on the broader crypto news cycle too, since altcoins this small often move with overall risk appetite, not just their own headlines.
Conclusion
The Capricorn $APR price staged one of the sharper single-day moves this altcoin has seen, and it wasn't random. A real buyback, a tokenomics reveal, and a short squeeze all landed close together. But the same concentration that let a handful of wallets move this market fast could just as easily reverse it. Watching the $0.148 support and the top wallet's next move matters more than any single indicator right now. For token-specific catalysts like this, it also helps to track coin event calendars.
Disclaimer: This article is for informational purposes only and is not financial advice. Cryptocurrency markets are highly volatile.
Also read:

















