aPriori Price Prediction: Why Did APR Just Rip 60% Overnight?


You open your portfolio, and one line is glowing green while everything else looks the same as yesterday. That is basically what happened to aPriori holders in the last 24 hours. APR has gone from a quiet mid-cap sitting near its support zone to one of the loudest tickers on the crypto volume boards, and the move has already dragged in traders who had never heard the name a week ago.
APR Woke Up And Decided the Range Was Over
Every aPriori price prediction discussion this week starts with the same chart, and for good reason. A token that spent months grinding sideways just broke out with force, and that kind of move tends to pull in attention fast.
Here's the thing: sideways charts get ignored. Breakout charts get bookmarked.
We watched the daily candle print, and the first thing that stood out was how thin the wicks were on the way up. Buyers were not hesitating.
But strength alone does not answer the real question traders actually care about.
Where does this go from here, and what would make it fall apart?
Key Takeaways
APR broke out of a multi-month range with a single daily candle, gaining roughly 60% in 24 hours.
The move pushed daily RSI to 76, a level that usually invites a cooldown before the next leg.
Nearest resistance sits near 0.3633, with a bigger wall at 0.4866.
Support has shifted up to the 0.18125 zone, with deeper support near 0.14769.
Holder concentration is extreme, with the top 10 wallets controlling over 94% of supply, a real risk factor for any aPriori price prediction.
Why Is aPriori Price Moving Today?
Volume is the tell here. APR's 24-hour trading volume jumped to roughly 19.72 million dollars, a 594% increase against the prior session, according to CoinMarketCap data captured at 14:20 UTC on August 12, 2026.
That is not organic drift. That is a coordinated wave of buying.
Exchange-level data backs this up too. The Bitget exchange listing activity around APR has been picking up, and Binance alone is processing over 71 million dollars of APR volume right now, per the latest heatmap snapshot.
And OKX is not far behind at 44.36 million.
Turns out, when three or four exchanges all see inflow at once, price does not creep. It jumps.
We cannot confirm a single named catalyst like a partnership announcement, and no verified press release has surfaced as of this writing. So the honest read is this: this looks like a volume-driven momentum spike layered on top of an already-forming ascending channel, not a one-off news pump.
Where Is the APR Price Right Now?
As of 14:20 UTC on August 12, 2026, aPriori (APR) is trading at approximately $0.3156, up 59.48% over the past 24 hours, per CoinMarketCap market data.
Market cap sits near $87.68 million. Fully diluted valuation is much higher at $316.62 million, since only 277.81 million of the 1 billion total supply is circulating.
Liquidity-to-market cap sits at 0.91%, which is thin. Thin liquidity is exactly why a move like this can happen so fast in both directions.
aPriori Technical Analysis
Short-Term Technical Chart Analysis
On the daily chart, APR broke a tight descending channel with one explosive green candle. The price jumped from near $0.206 to a high of $0.326, trading around $0.315.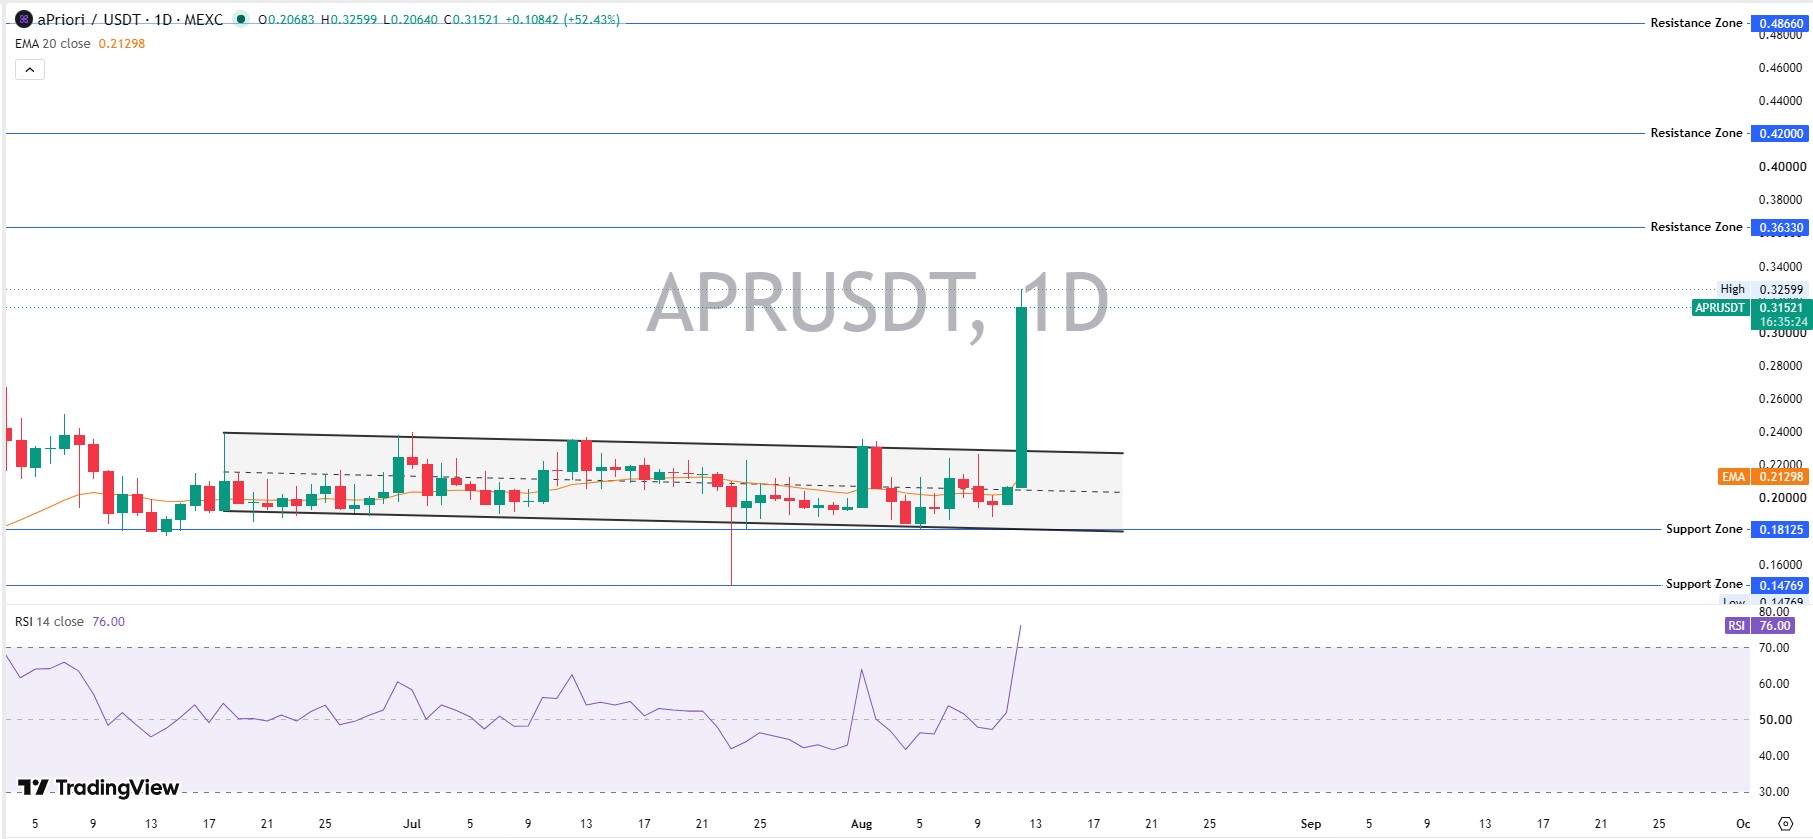
RSI 14 spiked to 76, deep in overbought territory. That kind of reading rarely holds for long without some cooling off.
EMA 20 sits far below current price at $0.213, which shows just how extended this candle really is against the recent average.
Short-term pullbacks toward the 0.24 to 0.26 zone would count as normal profit-taking, not trend failure, as long as buyers defend that zone and volume stays elevated on any bounce.
Long-Term Technical Chart Analysis
Zooming out to the weekly chart changes the picture completely. APR has been inside a well-defined ascending channel since February, and this breakout candle is the strongest push yet within that structure.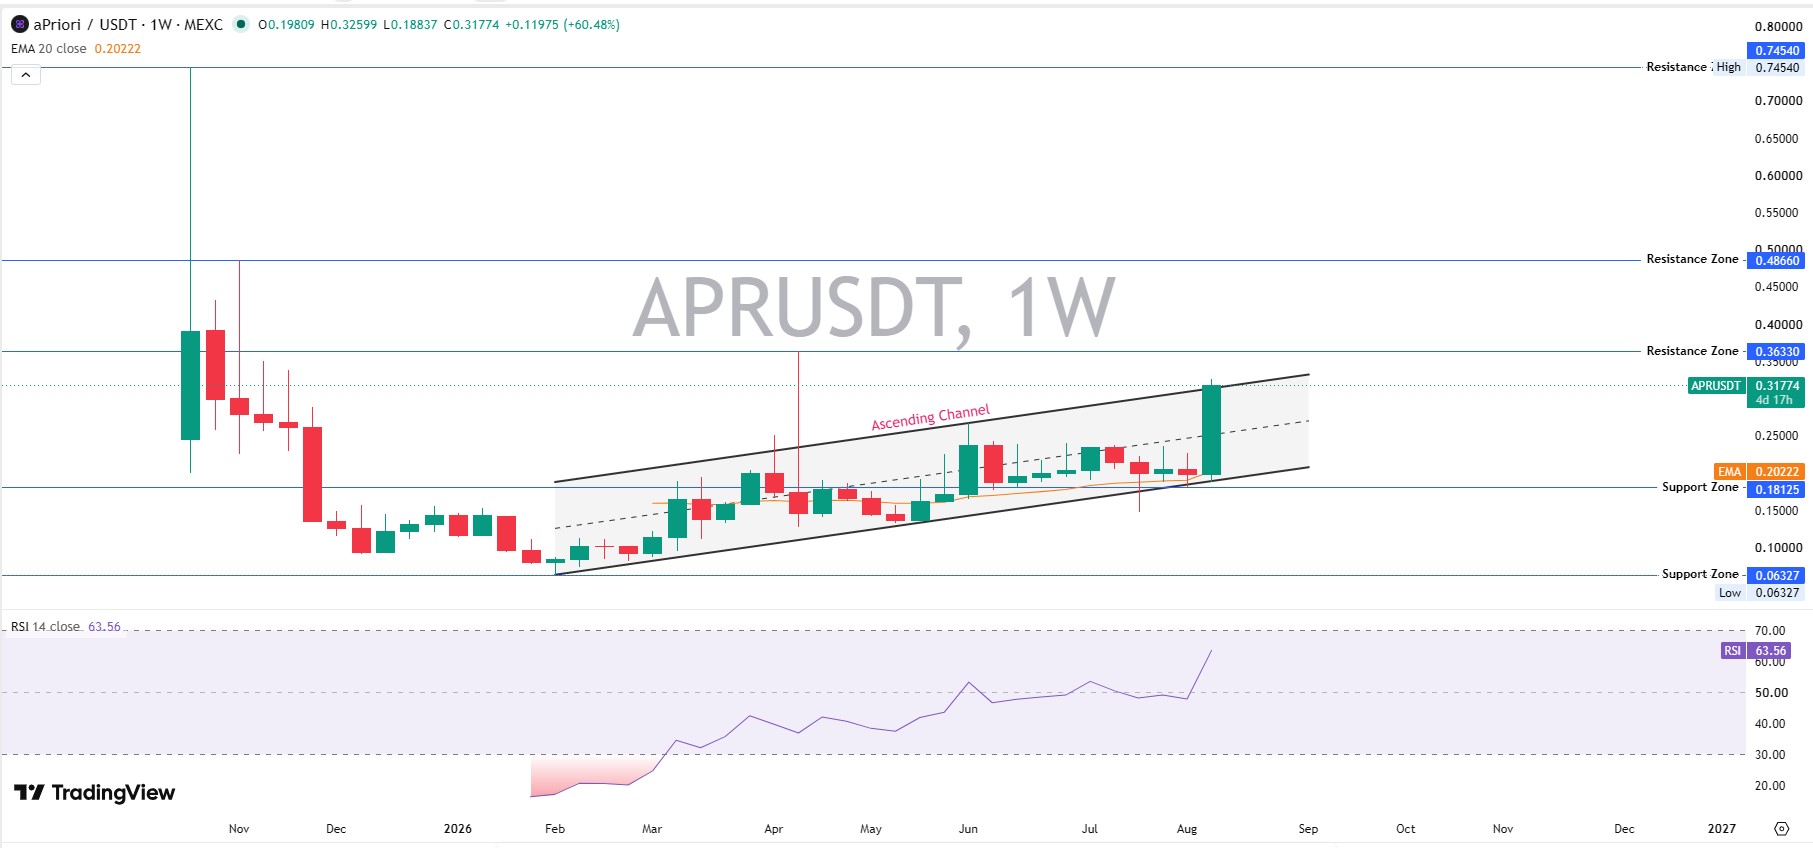
Weekly RSI sits at 63.56, still with room before hitting overbought. That gives this move more breathing space than the daily chart suggests.
The token remains far below its all-time high of $0.735 from October 2025, down about 57% from that peak even after this rally.
That gap suggests real medium-term upside room if buyers stay engaged and the channel holds through the next few weekly closes.
Chart Analysis: Support, Resistance and Structure
Resistance and support levels on APR are unusually clean right now, based on the weekly structure visible on the TradingView weekly chart.
First resistance: $0.3633. Second resistance: $0.4866. Major resistance: $0.7454, close to the all-time high.
Support has flipped. The old resistance zone near $0.18125 now acts as the first line of defense, with deeper support at $0.06327, the multi-month low.
A daily close above $0.3633 would open a path toward $0.4866. A daily close below $0.18125, on the other hand, would put the whole breakout thesis in question.
Altcoin Fundamentals: Tokenomics, Whales and Liquidity
APR is a small-cap altcoin, not a memecoin, and its on-chain structure reflects an early-stage protocol still finding distribution.
Total supply caps at 1 billion APR, with only 277.81 million circulating, roughly 28%. That gap between market cap and FDV matters for any long-term aPriori price prediction, since future unlocks can add sell pressure.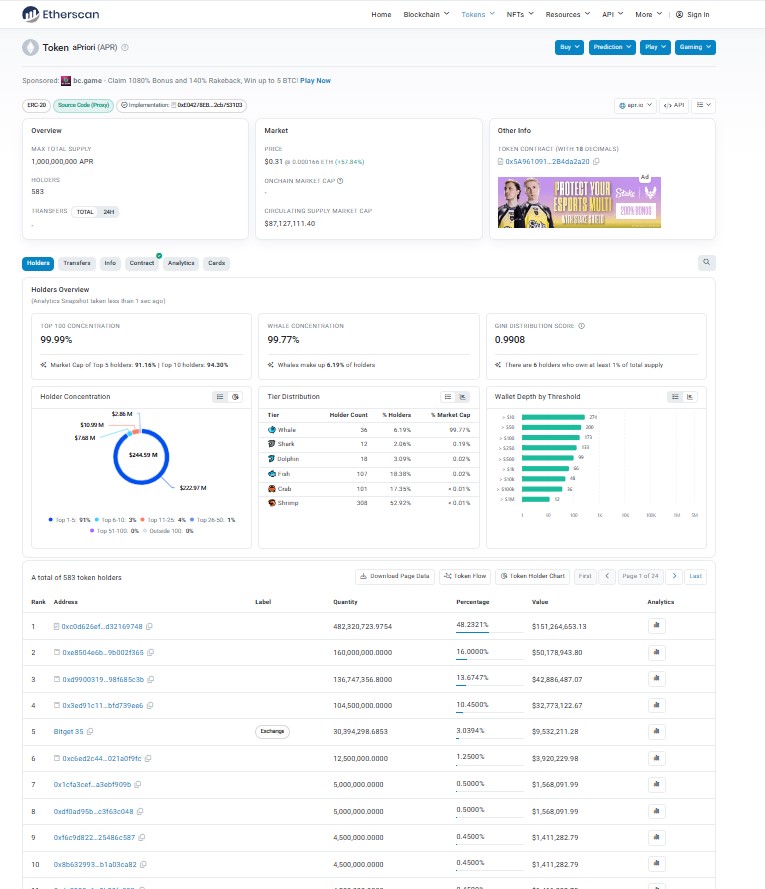
Holder concentration is the bigger flag. Per Etherscan holder data, the top 10 wallets hold 94.30% of supply, and the single largest wallet alone controls 48.23%. The Gini score sits at 0.9908, about as concentrated as it gets.
Whale-classified wallets make up just 6.19% of holders but control 99.77% of market cap, and one exchange wallet, Bitget, holds 3.09% directly.
That concentration cuts both ways. It can fuel sharp rallies when a big wallet accumulates, and it can just as easily fuel sharp drawdowns if that wallet decides to sell.
Liquidation data adds more texture. Over the past 24 hours, total liquidations hit $759.63K, with shorts absorbing $615.74K of that, meaning traders betting against the move got squeezed hard.
aPriori Price Prediction: Bear, Base and Bull Scenarios
Timeframe | Scenario | Price Target | Probability | Key Level | Invalidation |
7D | Bear | $0.19 - $0.22 | 25% | Loses $0.24 support | Daily close above $0.26 |
7D | Base | $0.28 - $0.36 | 45% | Holds $0.24, tests $0.3633 | Close below $0.18125 |
7D | Bull | $0.42 - $0.48 | 30% | Clears $0.3633 with volume | Rejection at $0.3633 twice |
30D | Bear | $0.14 - $0.18 | 20% | Breaks $0.18125 zone | Daily close above $0.36 |
30D | Base | $0.30 - $0.45 | 50% | Channel holds, RSI resets | Weekly close below $0.18125 |
30D | Bull | $0.55 - $0.74 | 30% | Breaks $0.4866 with sustained volume | Volume dries below $10M daily |
Early 2027 | Bear | $0.10 - $0.16 | 20% | Loses $0.14769 low | Sustained close below $0.18125 for 2+ weeks |
Early 2027 | Base | $0.35 - $0.55 | 45% | Channel structure holds into new highs | Weekly close below $0.18125 |
Early 2027 | Bull | $0.65 - $0.90 | 35% | Clears $0.7454 ATH zone with volume support | Repeated rejection at $0.4866 |
These are structure-based scenarios, not guarantees. Every crypto price forecast carries real uncertainty, and this one is no exception.
What Could Invalidate This Forecast?
A daily close below $0.18125 would break the current channel structure and shift bias back toward bearish continuation.
A sudden drop in exchange volume, back under $10 million daily, would also weaken the bull case fast. Watch that number closely.
Key Risks for APR Holders
Extreme whale concentration means single-wallet selling could trigger outsized volatility.
Liquidity remains thin relative to market cap, so slippage on larger trades is a real concern.
Roughly 72% of total supply is not yet circulating, and future unlock events could add sell pressure regardless of chart structure.
Conclusion
APR just delivered one of its sharpest moves in months, and the structure behind it looks like more than a random spike.
But a 60% candle with RSI at 76 rarely goes in a straight line from here. Some cooling off would be normal, even healthy.
Watch $0.3633 above and $0.18125 below. Those two levels will likely decide the next chapter of this aPriori price prediction story.
For readers tracking the wider market, the same volatility playing out across Bitcoin price levels often sets the tone for how altcoins like APR trade next.
Ethereum tells a similar story right now, and the latest Ethereum price forecast is worth a glance for broader market context.
Momentum got everyone's attention today. Whether it holds is a different question entirely, and the latest crypto news today is worth checking for the answer.
Keep an eye on the upcoming coin events too, since listings and unlocks tend to move thin-liquidity charts like this one.
Disclaimer: This article is for informational purposes only and is not financial advice. Cryptocurrency markets are highly volatile. Data was sourced from CoinMarketCap, CoinGlass, Etherscan, and TradingView, captured on August 12, 2026, at 14:20 UTC.

















