- News
- Price Prediction
- Press Release
- Crypto Airdrop ›
- Presale / ICO ›
- Events
- Listing
- Tools ›
- Casino ›
-

Cardano (ADA) price experienced notable movements in the past 24 hours, with a 6.6% decline, dropping from around $0.97 to $0.91 by 13:00 UTC. This decline showed what seems like a long-standing volatility in the market and denotes a short-term selling pressure.
ADA performed well during the past week and month, maturing by 11.5% and 23.5%, respectively. As analysts monitor its price action closely, some see potential for a reversal in the coming days, underpinned by technical indicators.
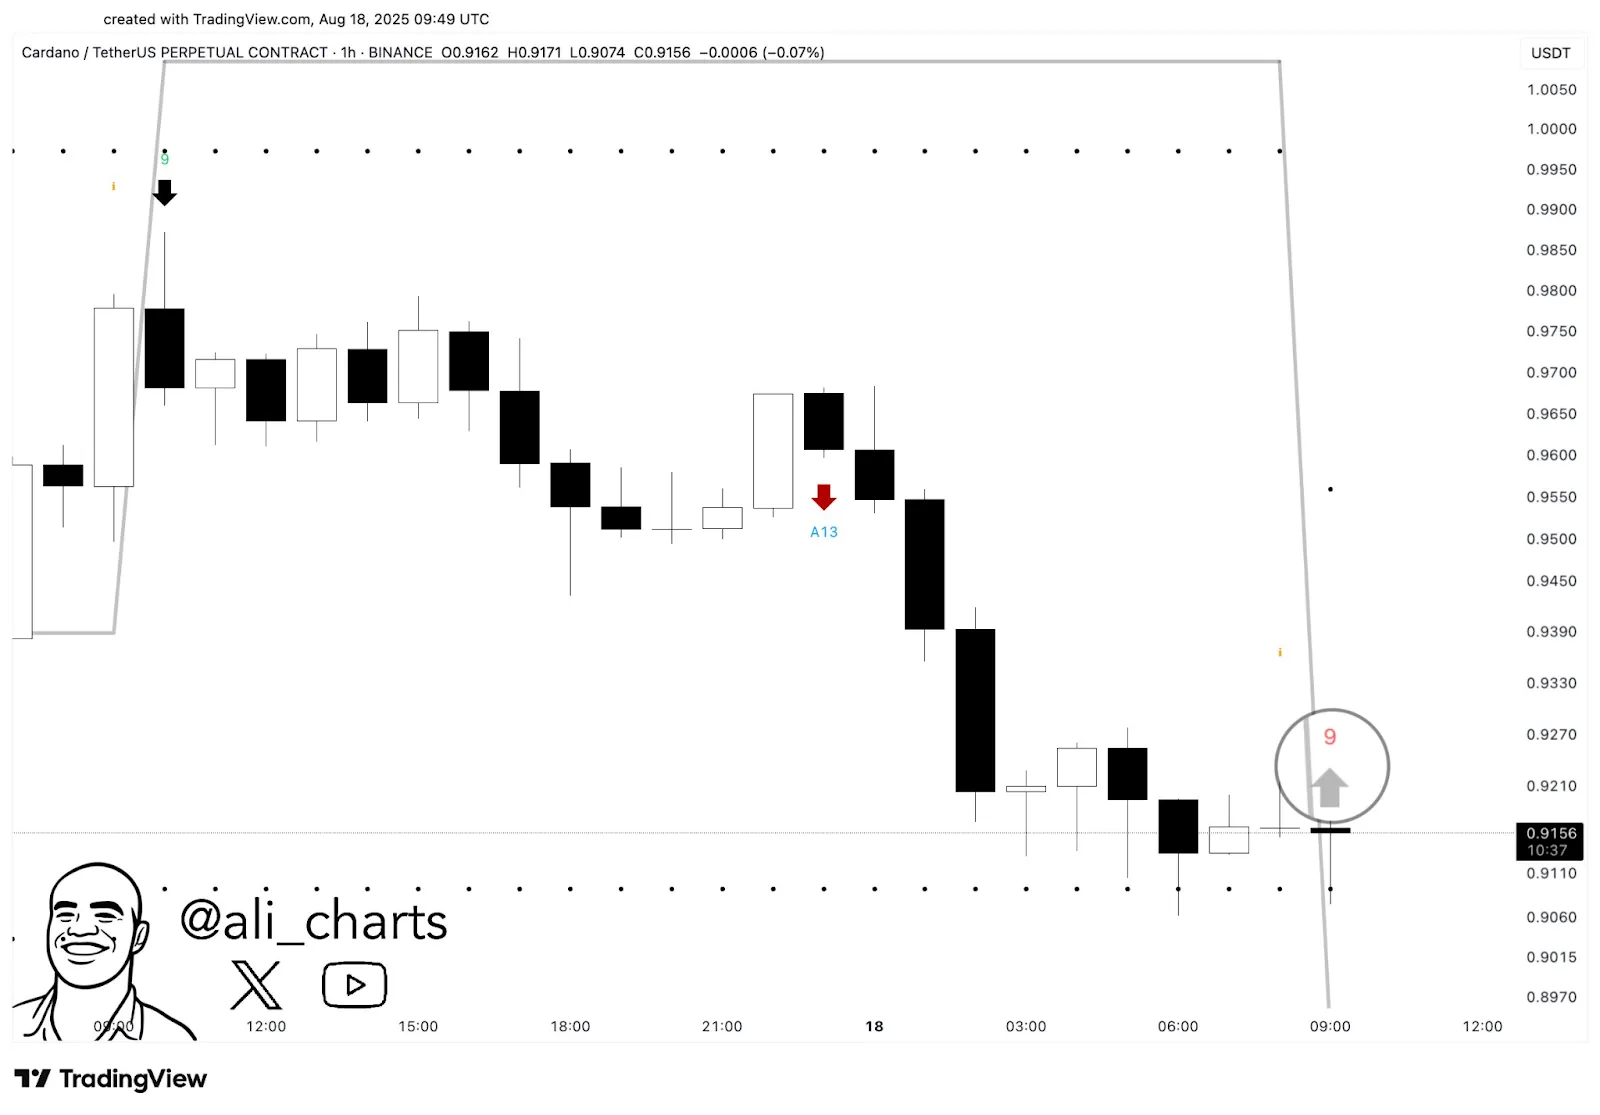
The price drop has triggered the attention of analysts who believe that Cardano may be near a turning point. Most importantly, the trader Ali Martinez points out a buying opportunity in the altcoin. The TD Sequential indicator, which traces price extremes to its predicted exhaustion of a trend, indicated that the present downtrend may be drawing to a close.
Source: X
The A13 setup - shown via a red arrow on the chart - might well be an indication that the bearish phase is over. The TD Sequential countdown has reached "9," an important number indicating market exhaustion and the possible reversal of momentum.
This setup, along with the recent drop in price to a support level about $0.9156, has made some traders hopeful for a reversal on the condition that price stays above this level. Although price action is telling a story of downward trends, these technical signals refute that. ADA could be gearing up for an upside move, perhaps offering an entry window to a few traders.
Besides the short-term indicators, Gambardello's analysis sheds some more light on the probable long-term price movement. He points only to the $1.25 resistance level that has previously capped the altcoin price over recent moves. Breaking this crucial level would, hence, be significant, perhaps even the defining event that sparks a bull run.
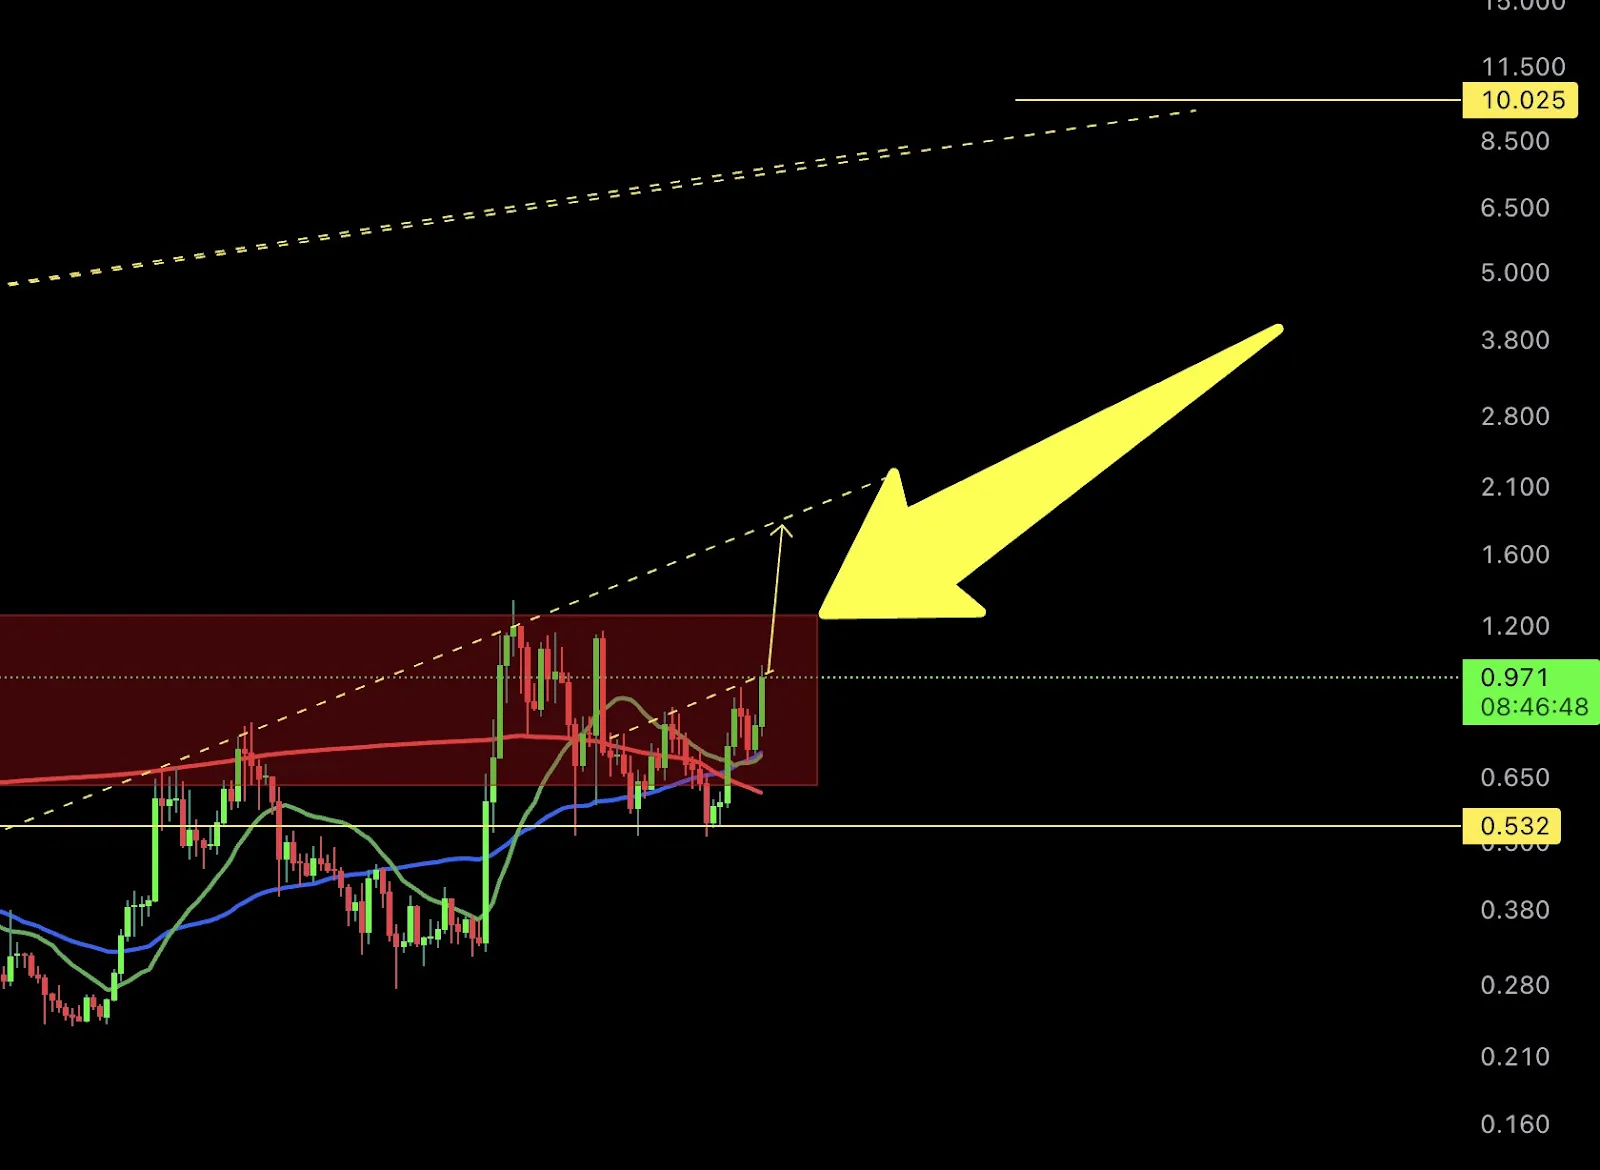
Gambardello mentions the green and blue moving averages, which seem to support the bullish momentum. Lastly, the chart shows that the key trendline-just tested into, marked with a dashed yellow line-is signaling a change in momentum to the upside.
But $1.25 is not only a resistance point; it is also a barrier that will decide on ADA’s near-term performance. A successful break above $1.25 puts the altcoin towards a higher resistance at $1.50, with the lingering possibility of am extended bull-run.
However, failure to break through the $1.25 resistance will leave the price exposed to a large retracement. There is also a nearby crucial support around $0.53, which Gambardello points out would be an important level for ADA if things start to worsen.
Despite recent volatility, the altcoin price action remained closely watched by investors and analysts alike. ADA performance over the past week and month reflects its potential for growth, yet the ongoing fluctuations underscore the uncertainty in the short-term market.
Owned by:-
DCG Tech FZCO, UAE
Delivery Partner:-
Gabbar MediaTech Pvt Ltd.
Copyright © 2026 Coin Gabbar. All Rights Reserved


