Cardano Price Prediction: Can ADA Reclaim $1? Historic Upgrade Rally?


Cardano is buzzing across trading communities right now, after pulling off something the network has never done before.
Cardano positions itself as a research-driven blockchain platform built for smart contracts and scalable decentralized apps, according to the project's own materials.
This Cardano Price Prediction looks at what this milestone could mean for ADA going forward.
Stick around till the end to see what the charts are hinting at next.
ADA Price Prediction: Market Overview
| Metric | Value |
| Current Price | $0.1751 |
| 7 Day Change | +10.6% |
| 24h Range | $0.1615 - $0.1774 |
| Market Cap | $6.538B |
| Fully Diluted Valuation | $7.89B |
| 24h Trading Volume | $453.907M |
| Circulating Supply | 37.288B $ADA |
| Total / Max Supply | 45B $ADA |
Source: Data from CoinGecko as of 21/07/2026. Figures may vary slightly across other tracking websites.
ADA Price Forecast: Why Is ADA Price Rallying After the Hard Fork
Cardano's own official account confirmed that the network has enacted its van Rossem hard fork, known as Protocol Version 11. 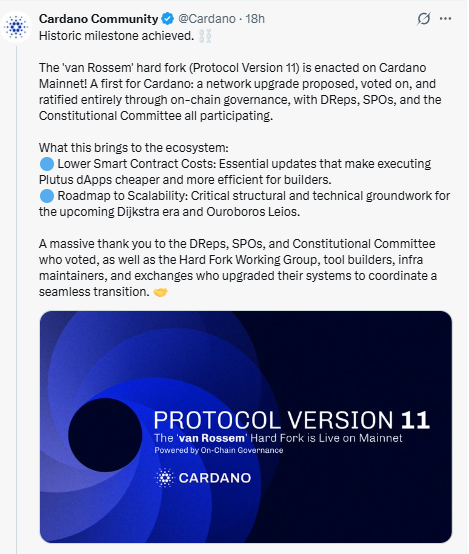
This is a genuinely historic moment for the project, since it marks the first Cardano upgrade ever proposed, voted on, and ratified entirely through on-chain governance, with DReps, SPOs, and the Constitutional Committee all taking part in the process.
The upgrade brings two concrete benefits to the ecosystem. It lowers smart contract costs, making it cheaper and more efficient for builders to run Plutus-based decentralized apps.
It also lays technical groundwork for future scalability upgrades known as Dijkstra and Ouroboros Leios.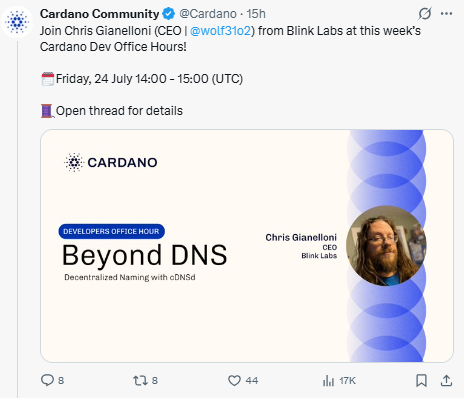
Alongside the hard fork, Cardano also has a developer session scheduled for Friday, July 24, featuring Blink Labs CEO Chris Gianelloni discussing a decentralized naming system called cDNSd.
This is smaller ecosystem activity rather than a price catalyst on its own, but it adds to the sense that Cardano development is picking up pace right now.
ADA price prediction 2026: ADA Price Chart Analysis
ADA fell hard from its May highs into June, creating what chart viewers call a left shoulder.
The price then dropped further into a deeper low, the head of the pattern, before bouncing and pulling back again to form a right shoulder that held above the head level.
Together, this forms a classic inverse head and shoulders pattern, a structure generally read as a bullish reversal setup once price breaks and holds above the neckline connecting the two peaks between the shoulders.
The price is now pushing up into that neckline zone, trading at $0.1751, up 3.18% on the day. However, if price fails to sustain this move and breaks below the $0.1573 support, it could fall further and potentially create a new low.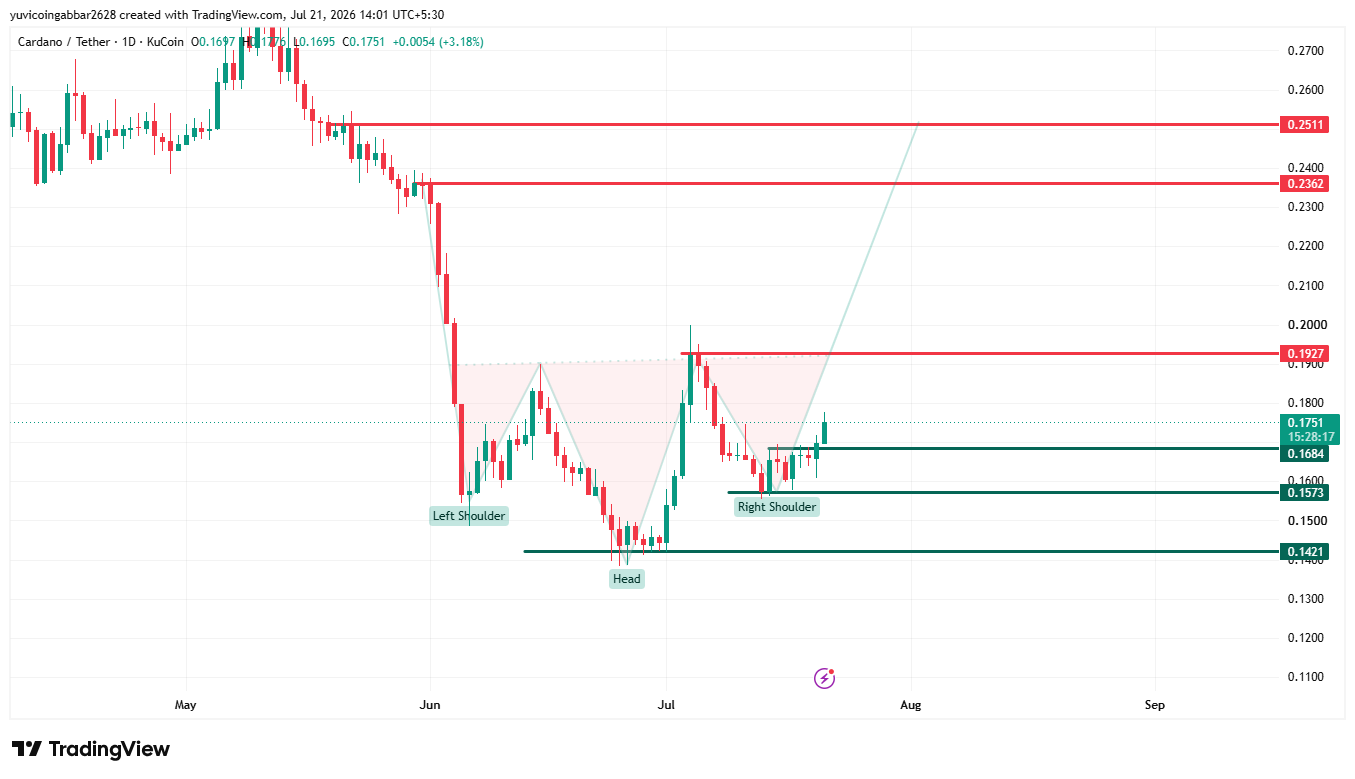
| Level Type | Price |
| Resistance | $0.2511 |
| Resistance (closer) | $0.2362 |
| Resistance (neckline) | $0.1927 |
| Immediate price reference | $0.1751 |
| Right shoulder support | $0.1684 |
| First confirmed support | $0.1573 |
| Head level (deeper support) | $0.1421 |
Verdict: a daily close above the $0.1927 neckline would be the clearest confirmation of this inverse head and shoulders pattern playing out. Until that happens, the pattern remains a developing setup rather than a confirmed breakout.
Two Reader Takeaways
For existing holders, the level to watch is the right shoulder support at $0.1684. Holding above that keeps the bullish pattern structure intact.
For anyone considering an entry, waiting for a confirmed close above the $0.1927 neckline offers a cleaner signal than buying into the pattern before it is confirmed.
ADA Market Outlook: Expert View
According to CoinGabbar analysts , the setup here leans constructive, backed by a real fundamental catalyst rather than just chart shapes.
The bull case rests on a confirmed close above the $0.1927 neckline, which would open the path toward $0.2362 and then $0.2511.
The bear case would need a break back below the right shoulder support at $0.1684, which would call the pattern into question and shift focus back toward the first confirmed support at $0.1573.
With the hard fork now live and the pattern testing its neckline, this is one of the more fundamentally backed technical setups in the market right now.
















