Cardano Price Prediction August 2026: Can ADA Reach $0.50 Next?


Cardano price prediction August 2026 remains one of the most searched ADA topics as traders watch whether the cryptocurrency can finally break its multi-month downtrend.
This analysis reviews support, resistance, RSI, and bullish and bearish scenarios using daily and weekly charts.
A sharp reversal off the recent low, followed by weeks of quiet consolidation, has traders asking whether ADA is finally building a base or simply pausing before another leg down. August could be the month that settles the question.
Cardano Price Today: Live Data and 24-Hour Change
ADA is trading near $0.1633, down 0.31 percent over the past 24 hours.
Futures volume sits at $406.47 million against spot volume of $62.29 million, with open interest at $379.66 million.
Market cap is $5.95 billion on a circulating supply of 36.50 billion ADA against a fixed max supply of 45 billion, putting roughly 81 percent of total supply already in circulation.
Source: Cardano Data Taken From Coinglass, data as of July 30, 2026. Figures may vary slightly across other tracking websites.
On-Chain and Fundamental Drivers (Cardano)
Cardano's mainnet has now processed more than 122.7 million transactions, with the network's eUTXO design allowing a single transaction to send funds to multiple recipients and execute several smart contract interactions at once.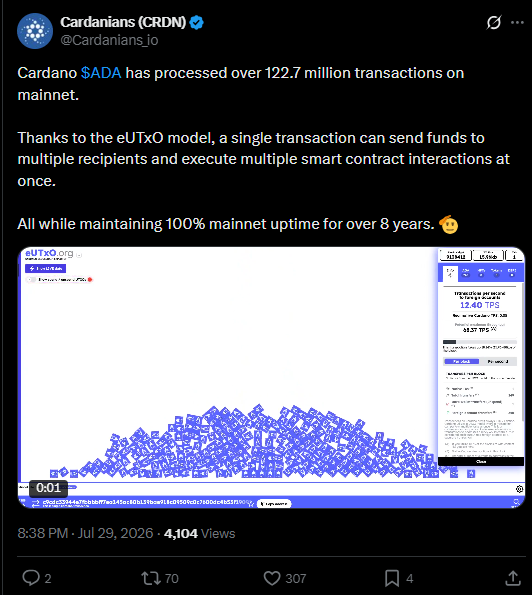
The chain has also maintained 100 percent mainnet uptime for over eight years, based on an update shared by Cardanians on X on July 29, 2026. Live futures and open interest data can be tracked on CoinGlass.
Quick Take
CMP: $0.1633 (-0.31% on the day)
Daily trigger: close above $0.1812 opens $0.1997-$0.2206, then $0.2900
Daily failure: below $0.1533 keeps $0.1380 as support
Weekly trigger: close above $0.1997 opens $0.3272, then $0.4826
Weekly failure: close below $0.1380 exposes the $0.10 psychological level
Daily RSI: 47.36 | Weekly RSI: 34.48
Data as of July 30, 2026, IST
Cardano Technical Forecast August 2026
On the daily chart, ADA has been sliding along a descending trendline for weeks, and the second tap of that line produced a lower low before price reversed sharply, a pattern worth tracking alongside the broader ADA breakout decision setup.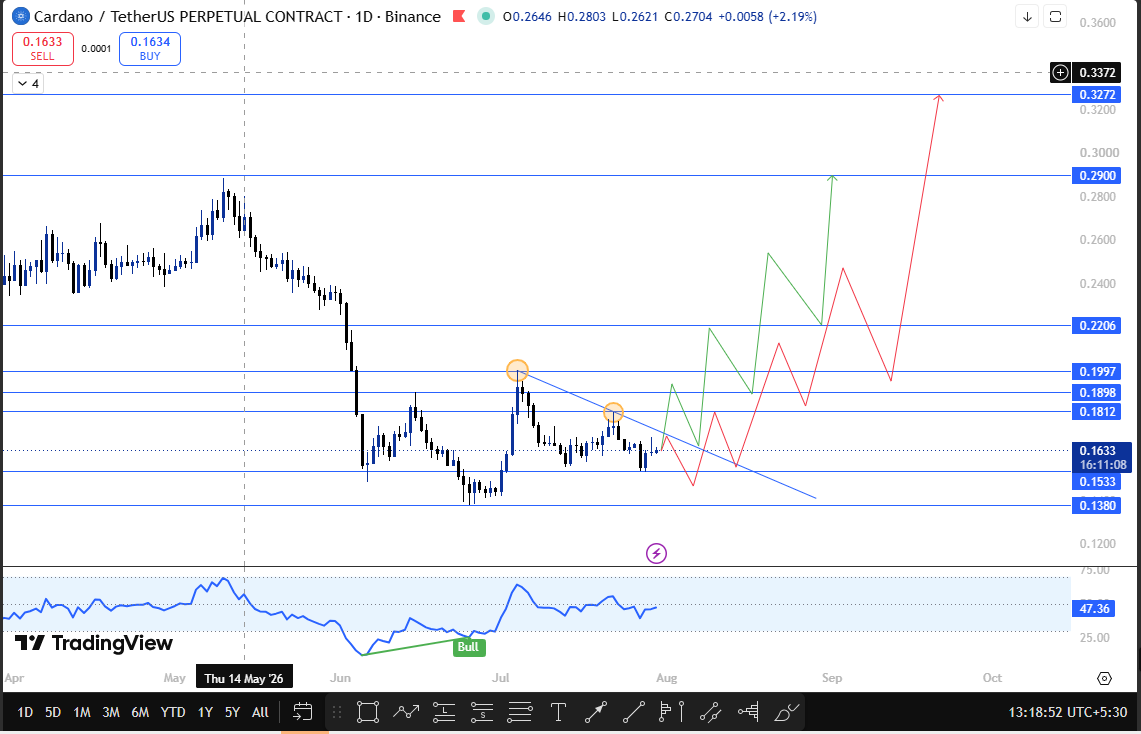
If that daily candle closes above $0.1812, the next resistance zone opens up at $0.1997-$0.2206, with $0.2900 coming into view after that.
A failure to close above $0.1812 keeps the focus on $0.1533 and then $0.1380 as the levels buyers need to defend.
The weekly chart tells a similar story on a slower clock.
Price has been following the same descending trendline down, but instead of breaking further, it is now holding, and a bullish marubozu candle formed right at the base of the range, a structure covered in more depth in the retest before rally analysis.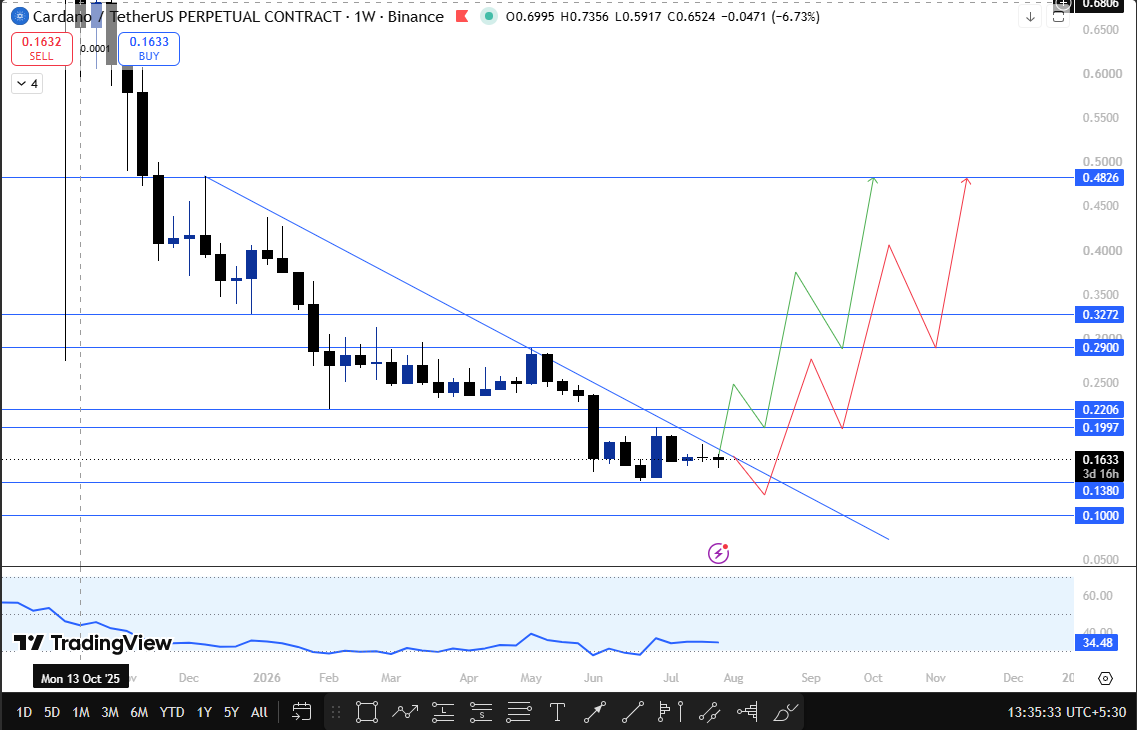
ADA has spent four straight weeks trading inside this zone.
A weekly close above $0.1997 would put $0.3272 and then $0.4826 on the table, while a close below $0.1380 would send the price toward the $0.10 psychological level.
Momentum readings support a cautiously improving picture without confirming it outright.
Daily RSI at 47.36 sits near the midline and shows a mild bullish divergence against the lower low in price, while weekly RSI at 34.48 remains below neutral, meaning the higher timeframe still needs to catch up before the bullish structure can be trusted, a point also raised in the prior breakout analysis.
Technical Analysis: Key Support and Resistance Levels (Cardano)
Timeframe | Resistance | Support | Trigger |
Daily | $0.1812, $0.1997-$0.2206, $0.2900 | $0.1533, $0.1380 | Close above/below $0.1812/$0.1533 |
Weekly | $0.1997, $0.3272, $0.4826 | $0.1380, $0.10 | Close above/below $0.1997 / $0.1380 |
Cardano Forecast : Bull, Base, and Bear Cases
The base case for August has ADA continuing to chop inside the $0.1380-$0.1997 band that has held for the last four weekly candles, without a decisive resolution either way.
The bull case activates on a confirmed daily close above $0.1812, which would open $0.1997-$0.2206 and then $0.2900, and gains further weight if the weekly candle closes above $0.1997 for a run at $0.3272 and $0.4826.
The bear case needs a weekly close under $0.1380, which would put the $0.10 psychological level back in play.
Each scenario depends on a confirmed close on its respective timeframe, not an intraday wick.
August 2026 Catalysts That Could Move Cardano
Continued growth in transaction throughput and eUTXO-driven activity is the clearest fundamental tailwind heading into August, since sustained on-chain usage tends to support accumulation during price consolidation.
Beyond that, ADA's next move will likely take cues from broader risk sentiment across Bitcoin, Ethereum, and the wider majors, since Cardano's own chart structure is currently range-bound and waiting for a catalyst rather than driving one.
What Analysts Are Forecasting (Cardano)
Sentiment around ADA is currently split between those reading the weekly reversal candle as the start of a base and those pointing to the still-soft weekly RSI as a reason for caution.
Neither view has been confirmed yet, and both are waiting on the same thing: a decisive weekly close outside the $0.1380-$0.1997 range.
Cardano Long-Term Outlook: 2027 to 2030
A sustained break above the weekly resistance zone of $0.3272 and $0.4826 would materially improve Cardano's longer-term structure, but that outcome still depends entirely on August's price action holding above the current range.
For context on how far ADA has fallen from prior levels, the long-term holder outlook piece covers the broader decline in more detail.
Risks That Could Invalidate This Forecast (Cardano)
The bullish case fails if the daily chart cannot close above $0.1812 and fails more decisively if the weekly candle closes below $0.1380, which would open the $0.10 level.
Broader risks include a shift in Bitcoin dominance, macro liquidity conditions, and general crypto market volatility, any of which could override Cardano's own technical structure regardless of how the trendlines are positioned.
How to Buy and Store Cardano Safely
ADA can be bought on major exchanges that support spot and futures markets, then moved to a personal wallet for storage rather than left on an exchange long-term.
Hardware wallets are generally considered the safer option for holding larger amounts, and enabling two-factor authentication on any exchange account is a basic but important precaution.
Glossary
Descending trendline: a downward-sloping line connecting a series of lower highs, used to track a prevailing downtrend
Marubozu candle: a candle with little to no wick, showing strong conviction in one direction for that period
RSI (Relative Strength Index): a momentum indicator scaled 0-100, where readings below 50 suggest weaker momentum and above 50 suggest stronger momentum
Support: a price zone where buying pressure has previously stepped in
Resistance: a price zone where selling pressure has previously capped upside
Psychological level: a round number, such as $0.10, that often acts as a support or resistance zone simply because traders watch it closely
Invalidation level: the price point at which a forecast scenario is considered incorrect
Disclaimer: This article is for informational purposes only and does not constitute financial advice. Cryptocurrency markets are highly volatile, and all price levels discussed are based on technical chart analysis, not a guarantee of future performance. Readers should conduct their own research before making any investment decisions.









.jpg)








