Hedera Price Prediction August 2026: Policy Chief Talk, Expert Outlook


Hedera is drifting lower inside a well-defined downtrend, even as its policy chief makes the case for why tokenization needs stronger governance rules.
Hedera is a public network using the hashgraph consensus mechanism, positioned for enterprise-grade applications like tokenization and payments, according to its own project materials.
This Hedera Price Prediction August 2026 looks at whether HBAR holds its short-term support or extends the current channel lower, alongside what the policy commentary means for the bigger picture. Here's the full breakdown.
Hedera Price Prediction Today: Market Overview
Metric | Value |
Price | $0.067782 |
24h Change | −1.07% |
Market Cap | $2.96B (−1.1%) |
Unlocked Market Cap | $3.22B |
24h Volume | $28.98M (−12.31%) |
Vol/Mkt Cap (24h) | 0.9767% |
FDV | $3.38B |
Total Supply | 50B HBAR |
Max Supply | 50B $HBAR |
Circulating Supply | 43.79B $HBAR |
Profile Score | 83% |
Source: Data from CoinMarketCap as of 30/07/2026. Figures may vary slightly across other tracking websites.
Hedera's Policy Chief on Governance and Tokenization
Hedera's Chief Policy Officer, Nilmini Rubin, argued in a Finextra piece that tokenization's real benefits transparency, programmable compliance, and auditability depend on governance frameworks being built in from the start rather than added later.
Her core argument is that cross-border interoperability is fundamentally a legal challenge before it's a technical one, pointing to standards work from CPMI-IOSCO and the Financial Stability Board, alongside jurisdiction-specific rules like Wyoming's stablecoin law. 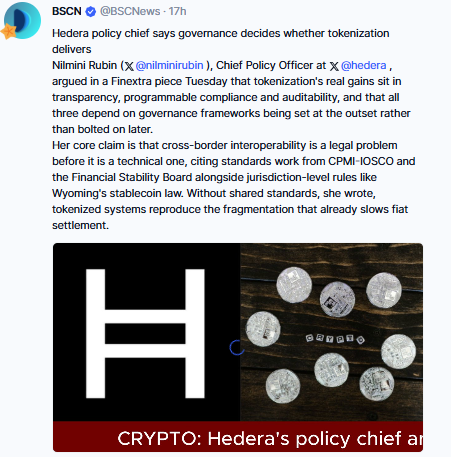
Source: Data From BSCNews
Without shared standards, she wrote, tokenized systems risk reproducing the same fragmentation that already slows down traditional fiat settlement.
This is commentary and policy advocacy from Hedera's own executive rather than a protocol announcement or confirmed roadmap item.
Hedera Technical Analysis: Short-Term Chart
Pair: HBAR/USD · Market: Spot (Crypto) · Timeframe: 4H · Source: TradingView · Timestamp: July 30, 2026, 16:55 UTC+5:30
HBAR trades at $0.067782; the broader short-term structure shows a clear descending channel after creating the high near $0.074 on July 23.
Price is currently below both the EMA 20 ($0.068312) and EMA 50 ($0.068854), which sit as overhead resistance with a clear downtrend with the channel.
RSI (14) at 42.39 is below neutral, consistent with the ongoing downtrend, though not yet at oversold levels.
If the price breaks the channel in any direction, then what are the important levels to watch? 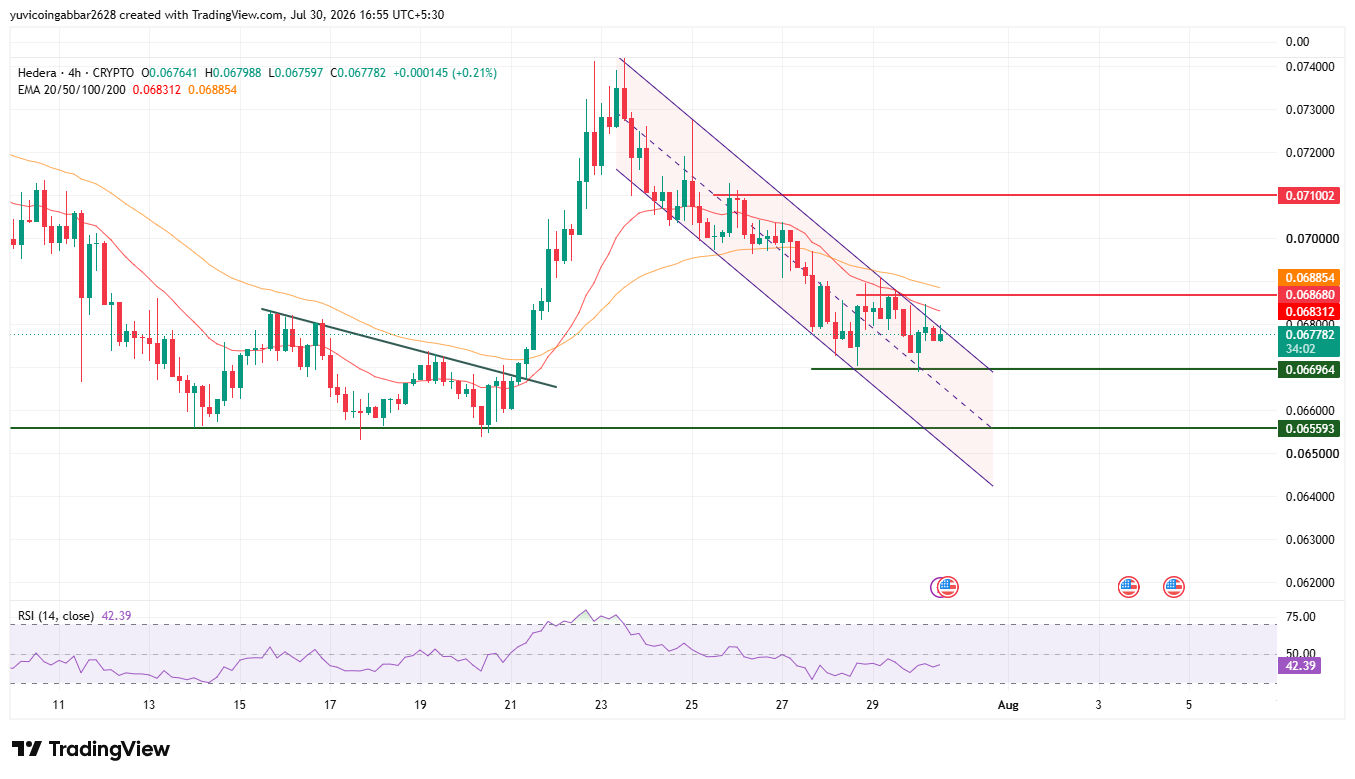
Level Type | Price |
Resistance 2 | $0.071002 |
Resistance 1 (EMA 50) | $0.068854 |
Initial Recovery Level (EMA 20) | $0.068312 |
Immediate Price Reference | $0.067782 |
First Support | $0.066964 |
Deeper Support | $0.065593 |
Hedera Technical Analysis: Long-Term Chart
Pair: HBAR/USD · Market: Spot (Crypto) · Timeframe: 1D · Source: TradingView · Timestamp: July 30, 2026, 16:57 UTC+5:30
Zooming out to the daily chart $HBAR has been in a steady downtrend with a descending trendline stopping every recovery attempt since.
The current price sits well below both the EMA 20 ($0.069359) and EMA 50 ($0.073021) on this timeframe, reflecting the depth of the multi-week decline.
RSI (14) at 42.32 mirrors the short-term reading, showing the broader trend remains weak without being deeply oversold.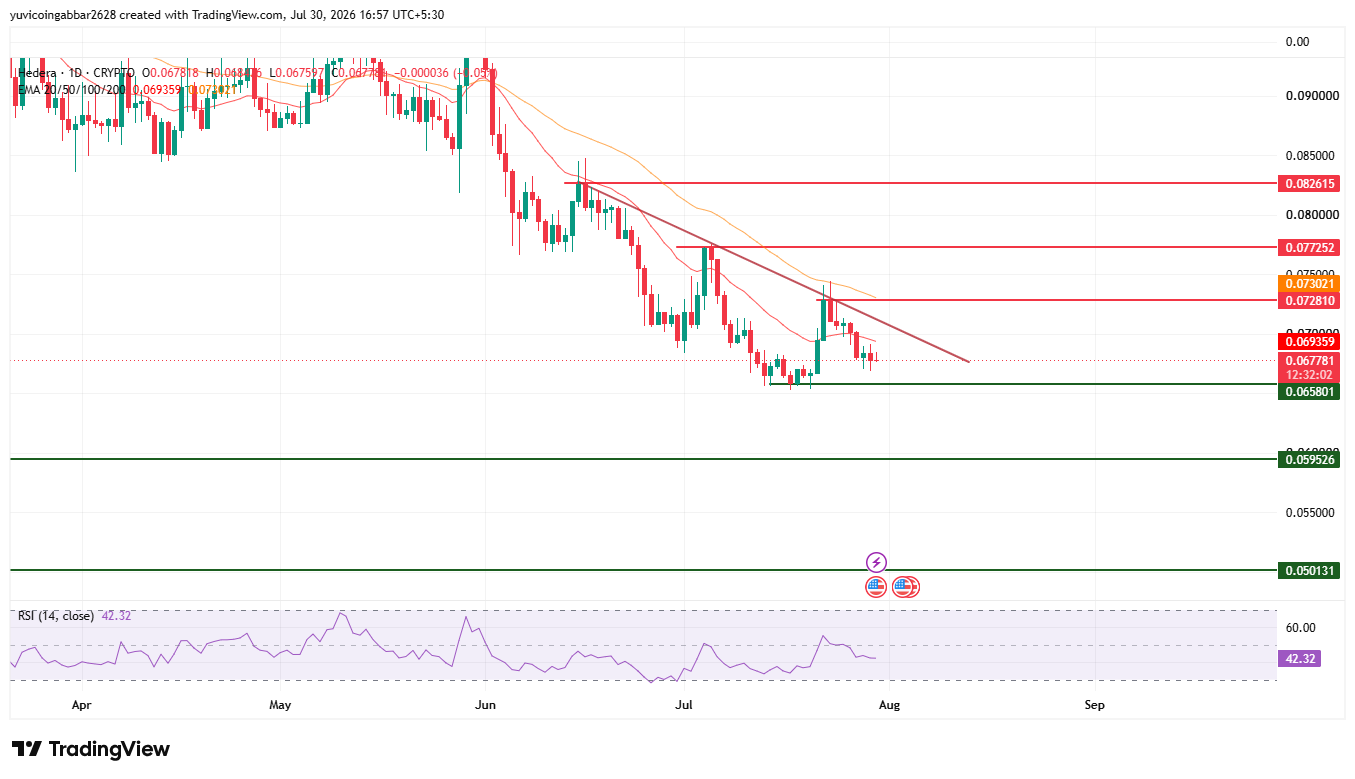
Level Type | Price |
Resistance 3 | $0.082615 |
Resistance 2 | $0.077252 |
Resistance 1 (EMA 50) | $0.073021 |
Initial Recovery Level (EMA 20) | $0.069359 |
First Support | $0.065801 |
Support | $0.059526 |
Deeper Support | $0.050131 |
Hedera Price Prediction: Bull Case vs. Bear Case
Bull case: If HBAR holds above $0.066964 and reclaims the EMA 20 near $0.068312–$0.069359, the next level is $0.071002, with a longer-term stretch toward $0.077252 if the broader downtrend line breaks.
Bear case: A confirmed break below $0.065801 on the daily chart would open a retest of $0.059526, and a failure to hold there could bring the deeper $0.050131 level into focus.
Hedera Price Prediction August 2026: Can HBAR Reach $0.077?
A move to $0.077252 would require HBAR to first break its multi-week descending trendline on the daily chart and clear the EMA 50 near $0.073021.
That's a meaningful trend reversal from the current setup, so it would likely need a broader shift in momentum rather than a short-term bounce within the existing channel.
Hedera next target: What Happens If HBAR's Support Breaks?
A confirmed close below $0.066964 on the short-term chart would be the first bearish signal, and a deeper break below the daily support at $0.065801 would suggest the broader downtrend is extending, opening room toward $0.059526.
HBAR forecast August: Expert Outlook
According to CoinGabbar analysts, HBAR's chart shows a textbook downtrend on both timeframes, with price capped by descending resistance and RSI readings in the low-40s on both the 4H and daily charts reflecting persistent, if not extreme, selling pressure.
Separately, the policy commentary from Hedera's Chief Policy Officer signals the network is positioning itself around regulatory and governance readiness for tokenization.
A longer-term fundamental narrative that doesn't directly address the current technical picture.
The near-term question remains whether $0.066964 holds as short-term support or whether the broader daily downtrend extends toward $0.059526.
Data Sources
Price, market cap, and supply data referenced from a CoinGecko-style tracker as of July 30, 2026, 16:55 IST. Policy commentary sourced from a Finextra piece by Hedera's Chief Policy Officer, as reported by BSCN. Chart analysis (EMA, RSI, support/resistance) sourced from 4H and 1D HBAR/USD charts on TradingView, timestamped July 30, 2026, 16:55 and 16:57 UTC+5:30 respectively.
Disclaimer: This article is for informational purposes only and should not be treated as investment advice. Cryptocurrency markets are highly volatile, and readers should conduct their own research before making any financial decisions.









.jpg)








