Cardano Price Prediction: The Next Few Candles Could Change Everything


Cardano price prediction chatter is heating up again as ADA finds itself parked right at a level that has done a lot of the heavy lifting for this rally already.
The 1-hour chart shows a structure traders watch closely because of how sharply these setups tend to resolve once a trendline either breaks cleanly or gets rejected, and ADA is sitting exactly at that pressure point right now.
Whichever way this breaks looks set to shape ADA's next leg.
Cardano Market Snapshot
Metric | Value |
Price | $0.1622 |
24h Change | +5.17% (+$0.008003) |
Market Cap | $5.93B |
Futures Volume (24h) | $493.23M |
Spot Volume (24h) | $80.33M |
Open Interest | $378.65M |
Circulating Supply | 36.50B ADA |
Total Supply | 44.99B ADA |
Max Supply | 45.00B ADA |
Data from the ADA/USDT 1-hour chart on Binance via TradingView and the Cardano market page on CoinGlass were captured on July 29, 2026, around 10:05 AM IST. Recheck live figures close to publish time since price and open interest shift fast.
Cardano Liquidation Data
As per CoinGlass liquidation data, captured July 29, 2026, around 10:05 AM IST.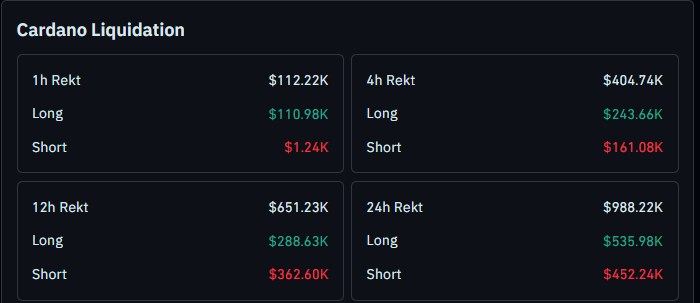
Longs have absorbed the bulk of forced closures across every window here, which fits a market where dip buyers have been stepping in early during the recent pullback rather than a market in genuine panic selling.
Quick Take
$ADA is trading near $0.1622, testing a descending trendline on the 1-hour chart with selling pressure building against it
Bullish trigger: confirmed close above $0.1672, opening room toward $0.1809 and $0.1900
Bearish trigger: confirmed close below $0.1614, opening room toward $0.1577, then $0.1522 and $0.1500
This is a short-term read, so recheck these zones if price closes well beyond this range on a higher timeframe
Cardano Technical Analysis
$ADA is currently trying to push through a descending trendline on the 1-hour chart, but the move is running into clear selling pressure rather than a clean break, a setup this ADA breakout decision coverage has been tracking closely.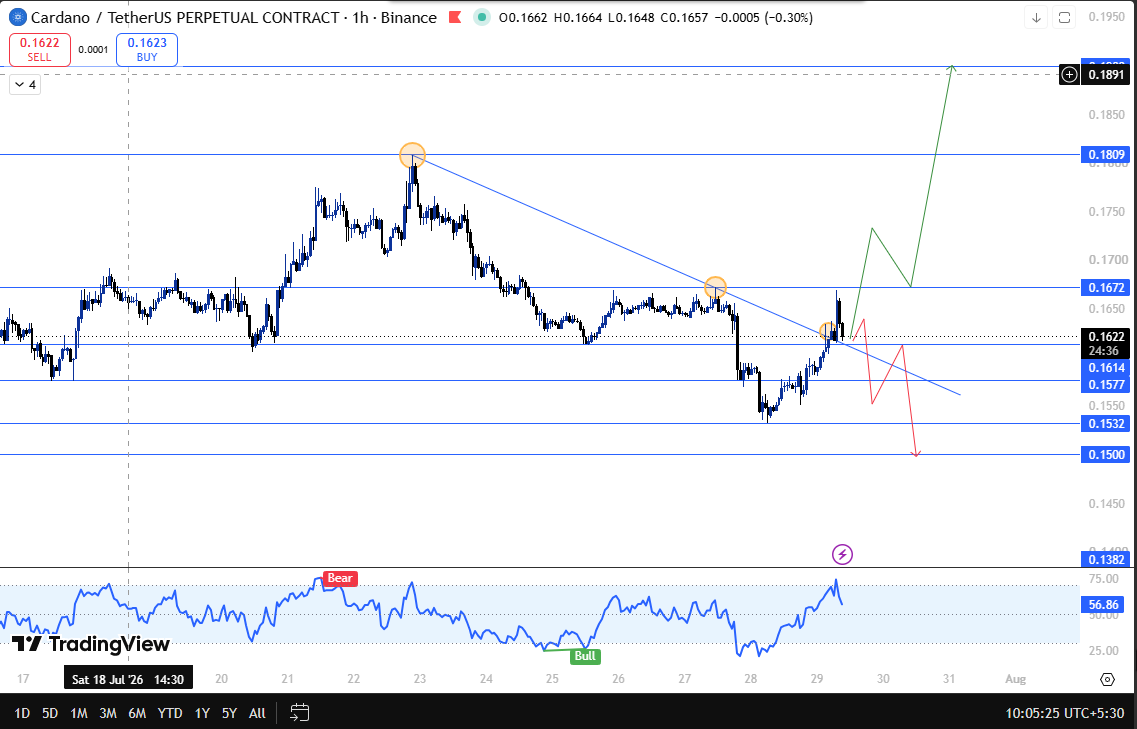
This is the kind of zone where a rejection can send price straight back into the range just as easily as a confirmed break can open the next leg higher, which is why this Cardano breakout analysis is centered on this exact level.
If $ADA fails to hold and closes below $0.1614, that marks the breakout attempt as failed and shifts focus to $0.1577 first, with $0.1522 and $0.1500 as further support levels if the drop continues, a scenario the Cardano flip zone breakdown update covers in more depth.
If instead $ADA closes above $0.1672, that tilts the setup back toward buyers and opens room toward $0.1809, with $0.1900 as the extended target if momentum carries through; a continuation of the Cardano next move loading piece is also watching.
As with any of these triggers, a confirmed close carries far more weight than a wick.
A brief spike through $0.1672 or below $0.1614 that gets reclaimed before the candle finishes does not confirm anything on its own, and treating a wick as a signal is one of the more common ways this kind of ADA technical analysis goes wrong.
Similar trendline retest behavior showed up in our Cardano retest before the rally piece, where support held before the next leg up.
$ADA Support And Resistance Levels
Level | Price | Note |
Resistance 2 | $0.1900 | Extended target on continued breakout |
Resistance 1 | $0.1809 | First target after clearing $0.1672 |
Breakout Trigger | $0.1672 | Needs a confirmed close |
Current Price | $0.1622 | Testing the descending trendline |
Breakdown Trigger | $0.1614 | Needs a confirmed close |
Support 1 | $0.1577 | First support if $0.1614 breaks |
Support 2 | $0.1522 | Next support level |
Support 3 | $0.1500 | Deeper support level |
Risk-Reward Table
Case | Trigger | Target |
Bull Case | Close above $0.1672 | $0.1809 toward $0.1900 |
Bear Case | Close below $0.1614 | $0.1577 toward $0.1522 and $0.1500 |
Invalidation: This breakout attempt holds only as long as ADA keeps closing above $0.1614.
A confirmed close below that undoes the setup and shifts focus to $0.1577, $0.1522, and $0.1500, while a close above $0.1672 confirms strength and opens the path toward $0.1809 and $0.1900, a scenario the Cardano broadening wedge flip zone coverage also touches on.
Expert View
Traders watching this Cardano price prediction seem fairly relaxed about the current pullback in selling pressure, and honestly, that makes sense.
A trendline test that runs into some resistance right after a sharp rally is usually just the market catching its breath, not a red flag.
What stands out more is the liquidation mix: longs are still taking the bulk of the hit here, not shorts, which usually means overleveraged buyers are getting shaken out rather than the broader market losing conviction.
Until $0.1672 or $0.1614 actually gives way on a closing basis, this still reads as a pause within the uptrend rather than the start of something worse.
Disclaimer
This article is for informational purposes only and does not constitute financial advice. Cryptocurrency markets are highly volatile. Please verify current data independently and consult a licensed financial advisor before making any investment decisions.









.jpg)








