Cardano Price Prediction: ADA's Next Move Starts Here


Cardano just did something it has not managed in weeks, and traders who have been watching this chart closely know exactly what that means.
A structure that looked broken not long ago flipped completely, and now the price is sitting at a spot that usually decides the next big leg.
This Cardano price prediction walks through what triggered the move, where the real decision zone sits, and what would flip the entire setup on its head.
Cardano Price Right Now
| Metric | Value |
| Price | $0.1745 |
| 24h Change | +0.17% (+$0.0002958) |
| Market Cap | $6.36B |
| Futures Volume (24h) | $478.97M |
| Spot Volume (24h) | $64.39M |
| Open Interest | $415.18M |
| Circulating Supply | 36.48B ADA |
| Total Supply | 44.99B ADA |
| Max Supply | 45.00B ADA |
Source: Cardano data on CoinGlass, as of July 23, 2026. Figures may vary slightly across other tracking websites.
Methodology And Data Sources
This Cardano price prediction is built using the 4-hour ADA/USDT chart on Binance via TradingView, combined with liquidation and open interest data pulled directly from CoinGlass.
Price levels mentioned here are based purely on chart structure and get invalidated only on a confirmed candle close beyond the stated trigger, not on an intraday wick.
Whale accumulation data referenced later in this article comes from Santiment, shared publicly by on-chain analyst Ali Charts, and is included purely for context, not as a standalone signal.
Why ADA Whale Buying Is Getting Attention Right Now
On-chain data is adding weight to what the chart is already showing. 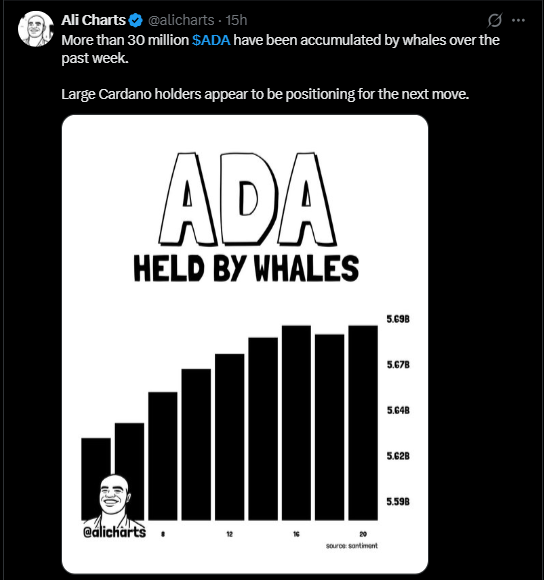
Analyst Ali Charts flagged that more than 30 million ADA have been picked up by large wallets over the past week, based on Santiment data, with big holders appearing to position ahead of the next move, as shown in this ADA whale accumulation post.
Big wallets adding supply during a period when price is still working through resistance is usually read as a sign that larger players expect higher prices down the line rather than a fade.
Cardano Liquidation Data Today (July 23, 2026)
Liquidation flow over the past day leans clearly toward short positions taking the hit. 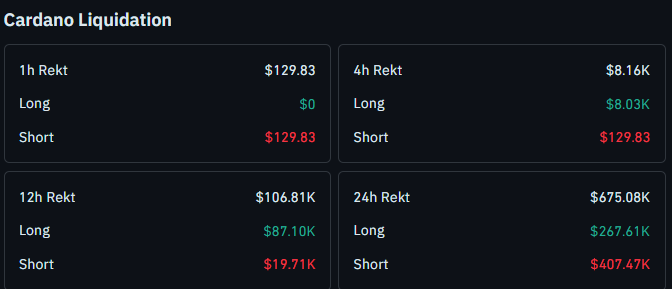
In the last hour, $129.83 was wiped out, and every bit of it came from shorts, with nothing lost on the long side.
The 4-hour window shows $8.16K in total liquidations, made up of $8.03K from longs and $129.83 from shorts.
Stretch that to 12 hours and the total climbs to $106.81K, with $87.10K coming from longs and $19.71K from shorts.
Across the full 24 hours, liquidations reach $675.08K, split between $267.61K in longs and $407.47K in shorts.
The heavier short liquidations over the full day line up with short sellers being forced to close positions The larger share of 24-hour short liquidations is consistent with bearish leveraged positions being forced to close as ADA moved above resistance. rather than rolling over the way many expected. A full breakdown is available through ADA liquidation data here.
The liquidation value remained small compared with total open interest, limiting its usefulness as a standalone directional signal.
Cardano Price Prediction: Chart Analysis
The story on this chart really started a few sessions back, when $ADA carved out a clear support base and then moved in a rising wedge pattern.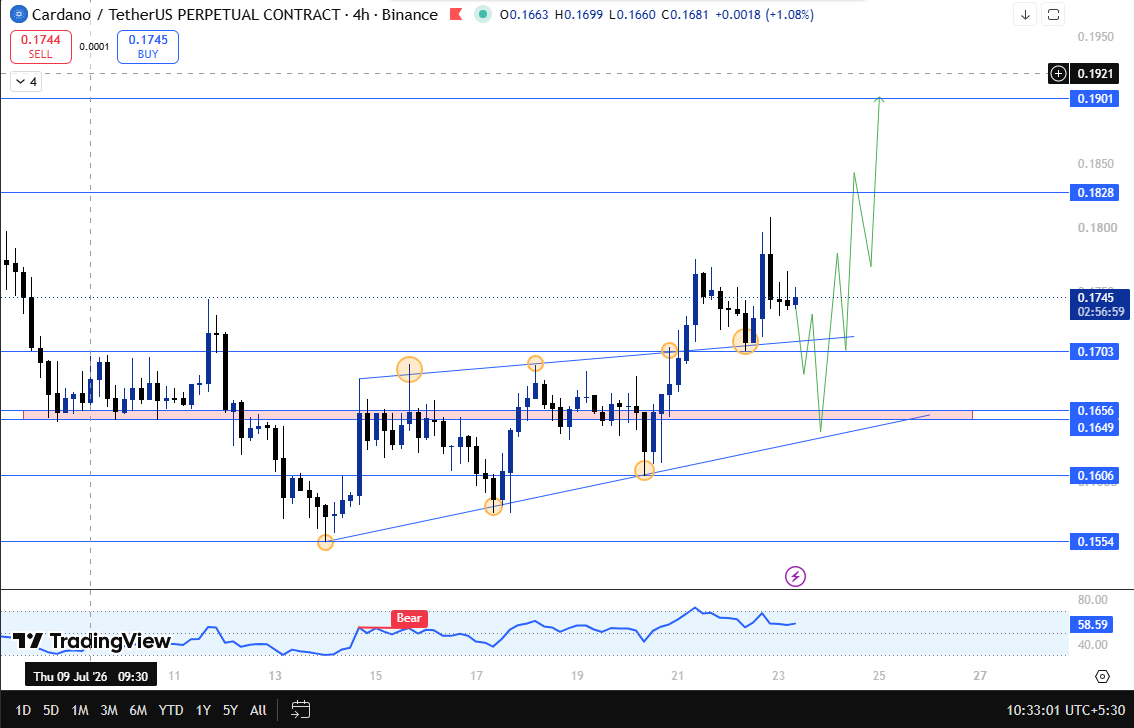
That wedge finally gave way, and $ADA broke above the wedge with strong bullish momentum. What happened after the breakout is the part worth paying attention to.
Instead of falling back through that broken zone the way weak breakouts usually do, price came back down, held the exact spot where the wedge broke, and ADA returned to the breakout area, held it as support and then moved to a higher high.
Right now, $ADA is pulling back from that recent high, and this pullback is exactly the kind of moment that decides whether the move has real legs.
As long as this retest holds, the path stays open toward the next resistance levels at $0.1828 and then $0.1901, similar to the continuation seen after our earlier coverage in previous ADA descending-channel analysis, where price has already climbed close to 9% since that forecast.
If ADA instead breaks down through $0.1703, that would open the door to a short-term downside move toward the flip zone sitting between $0.1656 and $0.1649, a range that has already switched roles between support and resistance before.
Should price slip below that flip zone and close under $0.1606, the current bullish setup would be invalidated completely, and the next level on the radar becomes $0.1554.
Cardano Support And Resistance Levels To Watch
| Type | Level | Note |
| Resistance 2 | $0.1901 | Extended upside target |
| Resistance 1 | $0.1828 | Immediate resistance on continuation |
| Current Price | $0.1745 | Retesting recent breakout zone |
| Caution Trigger | $0.1703 | A break below shifts bias short-term bearish |
| Flip Zone | $0.1656 - $0.1649 | The prior breakout base is now key support |
| Invalidation | $0.1606 | A confirmed close below breaks the setup |
| Support 3 | $0.1554 | Deeper downside target on breakdown |
Risk-Reward Table For This Cardano Setup
| Case | Trigger | Target |
| Bull Case | The retest holds, and price continues higher | Move toward $0.1828 and $0.1901 |
| Bear Case | Break below $0.1703 and later close at $0.1606. | Slide toward flip zone and then $0.1554 |
Invalidation Level For This Bullish Cardano Structure
This setup stays valid as long as ADA does not close below $0.1606.
A confirmed close beneath that level breaks the current bullish structure completely, and the next real support to watch on the downside becomes $0.1554.
Historical Context: How The Last Two ADA Calls Played Out
This is not the first time ADA has surprised traders who expected weakness. Our earlier read in ADA hard fork rally reclaim flagged a similar recovery attempt, and price followed through from there.
Before that, our call in ADA exploded after Van Rossem also caught an early move that played out largely as expected. The current wedge breakout and retest fits the same pattern of ADA quietly building strength before making its next real push.
Cardano Price Prediction Glossary
Rising Wedge: A pattern formed by two upward-sloping trend lines that converge as price swings narrow. It is commonly treated as bearish, although an upside breakout can occur.
Flip Zone: A price area that keeps switching roles, acting as support on one visit and resistance on the next, depending on which direction price approaches from.
Retest: When price returns to a broken level after a breakout to confirm that level still holds before continuing in the breakout direction.
Liquidation: What happens when a leveraged trade gets forcibly closed because the trader ran out of margin to keep the position open.
Whale Accumulation: A rise in the total token amount held by large wallets, often tracked as an early signal of institutional or large holder positioning.
Expert View On Cardano Price Prediction
The wedge breakout and clean retest remain the primary technical signals The breakout and subsequent retest are the main technical signals being monitored on the four-hour chart.. on this chart right now.
Price did not just break out and fade; it came back, held the exact zone that mattered, and pushed to a new high, which is a stronger signal than the breakout alone.
Add in whale wallets picking up over 30 million $ADA in the past week, as flagged through Ali Charts on X, and the broader picture leans toward continuation as long as $0.1703 holds.
A break below that level would not kill the setup outright, but a close under $0.1606 would be the clear signal that this structure has failed, opening the path toward $0.1554.
Disclaimer: This article is for informational purposes only and should not be considered financial advice. Cryptocurrency markets are highly volatile, and price predictions are not guaranteed. Please do your own research before making any investment decisions.
Also read:

















