Chainlink Price Prediction: Bulls Target $10 After Breakout


Chainlink price prediction interest is building again as LINK holds above the trendline it broke out of.
The token cleared a long descending trendline a few sessions back, and rather than slipping straight back under it, price has managed to sustain above that structure.
That said, the move hasn't been a straight climb. Price has been drifting lower in a gradual, grinding fashion since the breakout, and that slow fade is what's putting this setup back in focus.
Technical analysis prepared by CoinGabbar's crypto research desk. This piece is for informational purposes only and is not financial advice. CoinGabbar and the analyst do not hold a position in LINK at the time of publication.
The levels described here apply strictly to the 1-hour timeframe covered and should be rechecked if the price closes beyond the stated range.
Trend and Momentum: Key Takeaways
LINK broke its long descending trendline and has sustained above it since, though price has been fading gradually rather than extending
A confirmed close above $8.537 opens the door to $8.920, then $9.310
An aggressive, sentiment-driven rally could stretch this Chainlink price prediction toward the extended $10.025 target
A close below $7.884 would mark the breakout as failed and shift focus to $7.516 support
Liquidations have leaned toward shorts on the shorter windows but flipped firmly toward longs on the 12-hour and 24-hour windows
LINK Price Right Now
Metric | Value |
Price | $8.139 |
24h Change | +0.18% (+$0.01462) |
Market Cap | $6.10B |
Futures Volume (24h) | $243.35M |
Spot Volume (24h) | $33.33M |
Open Interest | $408.66M |
Circulating Supply | 748.09M LINK |
Total Supply | 1.00B |
Max Supply | 1.00B |
Open interest is the total value of derivative contracts still open across exchanges, a rough gauge of active leveraged positioning.
Chart source: 1-hour perpetual contract, TradingView, Binance data feed, captured August 5, 2026, around 12:50 PM IST.
Market cap, volume, and supply data from Chainlink market data on CoinGlass were captured the same day.
Methodology and Data Sources
This read uses the 1-hour chart for structure, with volume, open interest, and market cap figures from CoinGlass, and liquidation flow from CoinGlass's liquidation tracker.
Levels are only treated as invalidated on a confirmed closing candle beyond the stated trigger, not an intraday wick.
Adoption Update: Franklin Templeton Joins Canton Network
A fresh adoption signal is adding some background context to this forecast.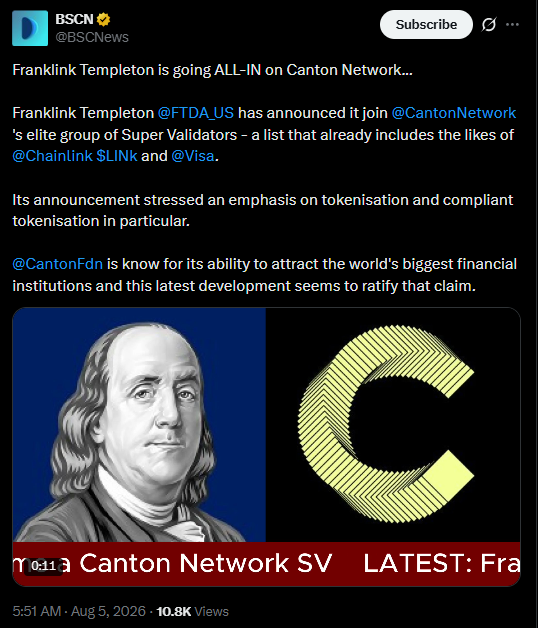
Franklin Templeton has reportedly joined Canton Network's group of Super Validators, a list that already includes Chainlink and Visa, with the announcement putting particular emphasis on tokenization and compliant tokenization.
The commentary framed this as another sign of major financial names gravitating toward the same infrastructure Chainlink is already embedded in, though it's worth treating this as a third-party summary rather than an official statement, and it isn't a direct price driver on its own.
Source: BSCN (@BSCNews), X, posted 5:51 AM IST, August 5, 2026.
Liquidation Snapshot
Liquidation flow has been mixed across timeframes. The 1-hour window saw just $20.65 wiped out, all of it from shorts.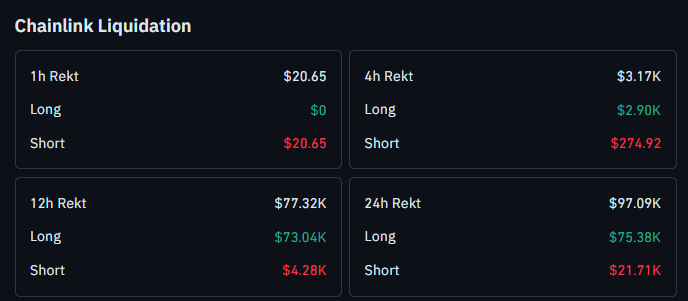
The 4-hour window stayed short-heavy too, with $3.17K total and $2.90K of that from shorts against a small $274.92 from longs.
The picture flips further out: the 12-hour window shows $77.32K in total liquidations, with $73.04K coming from longs against just $4.28K from shorts, and the 24-hour window shows $97.09K total, with $75.38K from longs and $21.71K from shorts.
That long-heavy skew on the longer windows lines up with the gradual pullback since the breakout.
Source: Chainlink liquidation data, CoinGlass, checked August 5, 2026, around 12:50 PM IST.
Is This Breakout Holding, Or Is It Starting To Fade?
Is the trendline break still intact, or is it quietly losing steam? Right now it's a bit of both.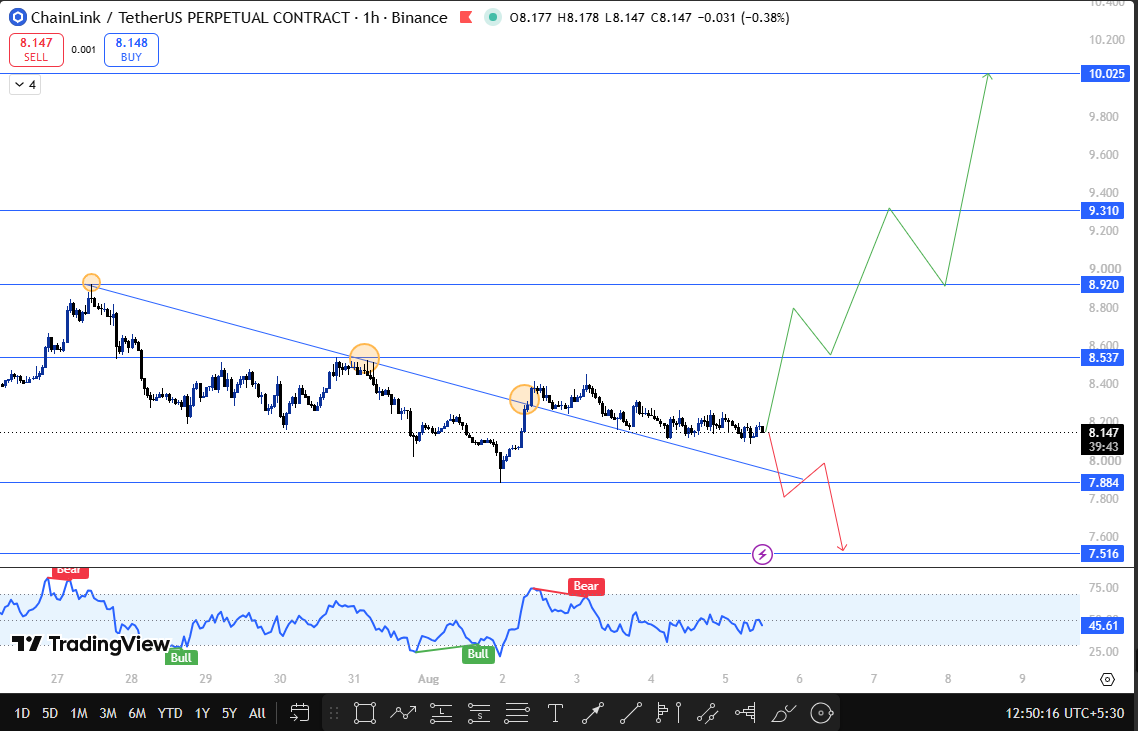
The line was cleared decisively, and price hasn't gone back to reclaim it as resistance, which is the encouraging part of this setup.
Three separate retests along the way down to that trendline held without a breakdown, and each time buyers showed up to defend the structure.
What's kept this from turning into a clean continuation is the pace since. Rather than extending higher after the breakout, price has been grinding lower in small steps, session after session, without giving up the trendline itself.
That kind of slow fade after a breakout is a signal worth watching closely, since it can resolve either way from here.
A confirmed close above $8.537 would be the trigger that puts this back on a bullish footing, opening the path to $8.920 and then $9.310.
If momentum turns aggressive and broader sentiment cooperates, an extended move toward $10.025 comes into view.
On the other side, a close below $7.884 would confirm the breakout has failed, and the next level to watch would be $7.516 support.
Technical Outlook Snapshot
Indicator | Signal |
Trend | Broke its long descending trendline and has sustained above it since |
Structure | Gradually fading lower after the breakout, no confirmed continuation yet |
Liquidations | Short-heavy on the 1-hour and 4-hour windows, long-heavy on the 12-hour and 24-hour windows |
Support and Resistance Levels to Watch
Type | Level | Note | % From CMP |
Extended Target | $10.025 | Needs an aggressive, sentiment-driven rally | +23.16% |
Resistance 2 | $9.310 | Second target on continuation | +14.39% |
Resistance 1 | $8.920 | First target after the breakout trigger | +9.59% |
Breakout Trigger | $8.537 | Confirms renewed bullish structure on a close | +4.89% |
Current Price | $8.139 | Grinding lower since the breakout | — |
Breakdown Trigger | $7.884 | Invalidates the breakout on a closing basis | -3.13% |
Support 1 | $7.516 | Next support if $7.884 fails | -7.66% |
Risk-Reward Table
Case | Trigger | Target |
Bull Case | Closes above $8.537 | Move toward $8.920, then $9.310, with $10.025 possible on an aggressive rally. |
Bear Case | Closes below $7.884 | Slide toward $7.516. |
What Would Change This Chainlink Price Prediction?
The setup stays undecided while the price holds between $7.884 and $8.537.
A confirmed close above $8.537 would validate the breakout and shift focus toward $8.920 and beyond, while a close below $7.884 would mark the breakout as failed and put $7.516 back in view.
Given how gradual this drift has been, a sharp move in either direction would carry more weight than another quiet grind.
How Bitcoin Sentiment Could Move LINK Higher
This setup is built off the token's own chart, but Bitcoin still tends to set the ceiling for how far a move like this one can extend.
A steadier Bitcoin tape improves the odds of clearing $8.537 and reaching for $9.310, and it's also part of what the extended $10.025 target depends on.
A weaker Bitcoin backdrop raises the risk that price keeps drifting toward $7.884 instead.
When This Chainlink Price Prediction Gets Revisited
This Chainlink price prediction will be revisited on a confirmed close above $8.537 or below $7.884, or if no clear direction is confirmed within 24 hours of publication.
Glossary
Descending Trendline: A downward-sloping line connecting successive lower highs, used to track resistance during a downtrend.
Open Interest: The total value of derivative contracts still open and unsettled.
Liquidation: The forced closing of a leveraged position when a trader runs out of margin.
Perpetual Contract: A futures-style contract with no expiry date, used to hold leveraged positions for as long as margin permits.
Bull, Base, and Bear Case
Bull Case: A confirmed close above $8.537 opens $8.920, then $9.310, with $10.025 in play if sentiment and Bitcoin cooperate.
Base Case: Price keeps grinding lower in small steps without giving up the trendline or triggering either level.
Bear Case: A close below $7.884 confirms the breakout failed and shifts focus to $7.516.
Disclaimer
This Chainlink price prediction is based on technical chart analysis and market data available at the time of writing. Cryptocurrency markets are highly volatile, and prices can change rapidly. This content is for informational purposes only and should not be considered financial advice. CoinGabbar and the analyst do not hold a position in LINK. Always do your own research and consult a qualified financial advisor before making any investment decisions.


















