Chainlink Price Prediction: LINK Eyes a Major Breakout


Chainlink price prediction watchers have plenty to chew on right now, because LINK is not just holding up near a tough resistance zone; it is actually managing to sustain there rather than getting rejected the way it has in the past.
That kind of stubbornness on a chart usually means something.
This breakdown uses chart structure, CoinGlass data, and fresh market news supplied for this piece.
The levels discussed here come from the daily LINK perpetual chart and represent a short- to medium-term view.
If the price moves decisively outside these ranges, this Chainlink price prediction should be revisited rather than assumed to still apply.
Chainlink (LINK) Price Right Now
Metric | Value |
Current Price (CMP) | $8.761 |
24-Hour Change | +0.79% (+0.06866) |
Market Cap | $6.56B |
Futures Volume (24h) | $416.40M |
Spot Volume (24h) | $54.72M |
Open Interest | $546.77M |
Circulating Supply | 748.09M |
Total Supply | 1.00B |
Max Supply | 1.00B |
Open interest currently stands at $546.77M, which is the total value of LINK futures contracts still open across the market.
That figure has room to grow further if a breakout confirms, since fresh leveraged positioning tends to follow once a resistance zone like this one gives way.
Chart source: TradingView, LINK/USDT Perpetual Contract, Binance, daily timeframe, captured 13 August 2026, around 11:48 AM IST (06:18 AM UTC). Data source: CoinGlass, Chainlink market page, captured 13 August 2026, around 11:48 AM IST.
Methodology and Data Sources
The structure behind this Chainlink price prediction comes from a direct reading of the daily LINK perpetual chart on Binance, tracking the ascending trendline and the horizontal resistance levels marked on it.
Market figures such as volume, open interest, and supply data are pulled from CoinGlass, and liquidation numbers come from CoinGlass's liquidation tracker for LINK. News context is credited with its original source and timestamp.
Standard Chartered's $200 Target and Hong Kong's Stablecoin Launch
Fresh news gives this Chainlink price forecast some real fundamental weight beyond the chart itself.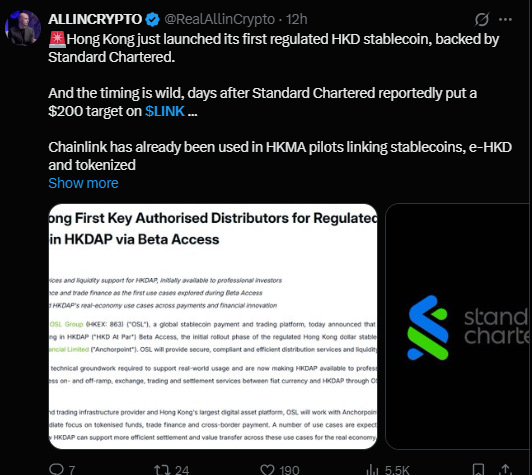
According to a post from ALLINCRYPTO on X, Hong Kong has just launched its first regulated HKD stablecoin, backed by Standard Chartered, and the timing stands out since it comes just days after Standard Chartered reportedly set a $200 price target on LINK.
The same post points out that Chainlink has already been used in Hong Kong Monetary Authority pilots involving stablecoin linking, e-HKD, and tokenized real-world assets, which suggests LINK's infrastructure is already embedded in exactly the kind of institutional plumbing this stablecoin launch depends on.
A $200 target from a major bank is obviously a long-range figure and should be treated as background context rather than a near-term price level.
Still, it adds a layer of institutional credibility to LINK's chart action at a moment when the price is already trying to hold above a key zone.
Source: ALLINCRYPTO on X, 12 hours before publication, referenced 13 August 2026.
LINK Liquidation Data Today
Liquidation flow on LINK right now is leaning heavily toward shorts getting squeezed, which fits with the price refusing to give up this resistance zone.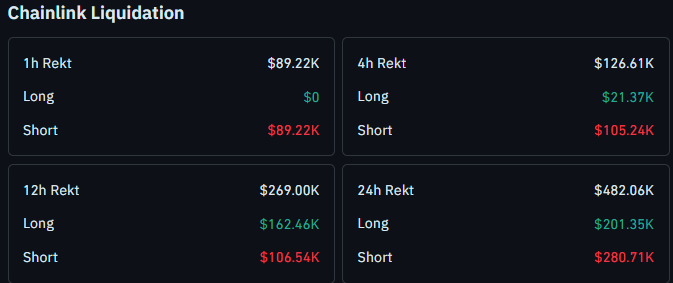
The last hour alone saw $89.22K in total liquidations, and every bit of it came from short positions, with longs sitting untouched at $0.
Over the 4-hour window, total liquidations reached $126.61K, made up of $21.37K in longs against a much larger $105.24K in shorts.
Zooming out to 12 hours, rekt totals climb to $269.00K, with $162.46K from longs and $106.54K from shorts, a window where longs actually take more of the hit.
Across the full 24 hours, total liquidations reached $482.06K, split between $201.35K in longs and $280.71K in shorts.
The short-term picture across 1h and 4h clearly favors shorts getting punished, while the wider 24h window shows a more balanced fight between both sides.
Source: CoinGlass, LINK liquidation data, captured 13 August 2026.
Chainlink Trend and Momentum: Key Takeaways
LINK is trading at 8.761; sustaining right at a resistance zone it has struggled with before
An ascending trendline sits below the current price, adding a second layer of support beneath the chart structure
A close above 8.920 opens the door to 10.025, then 10.854 as short-term targets
A close below 8.065 would flip the near-term picture bearish, pointing toward 7.884 next
A deeper breakdown could stretch as far as 7.516 if 7.884 also fails to hold
Short liquidations are dominating the 1h and 4h windows, consistent with price holding firm at resistance
Leveraged positions around any of these zones carry real liquidation risk, as the numbers above show.
These levels describe a chart-based framework, not a guarantee of what comes next.
Chainlink Price Prediction: Daily Chart Analysis
LINK has been climbing steadily along an ascending trendline for weeks now, and that rising structure is still very much intact underneath the current price.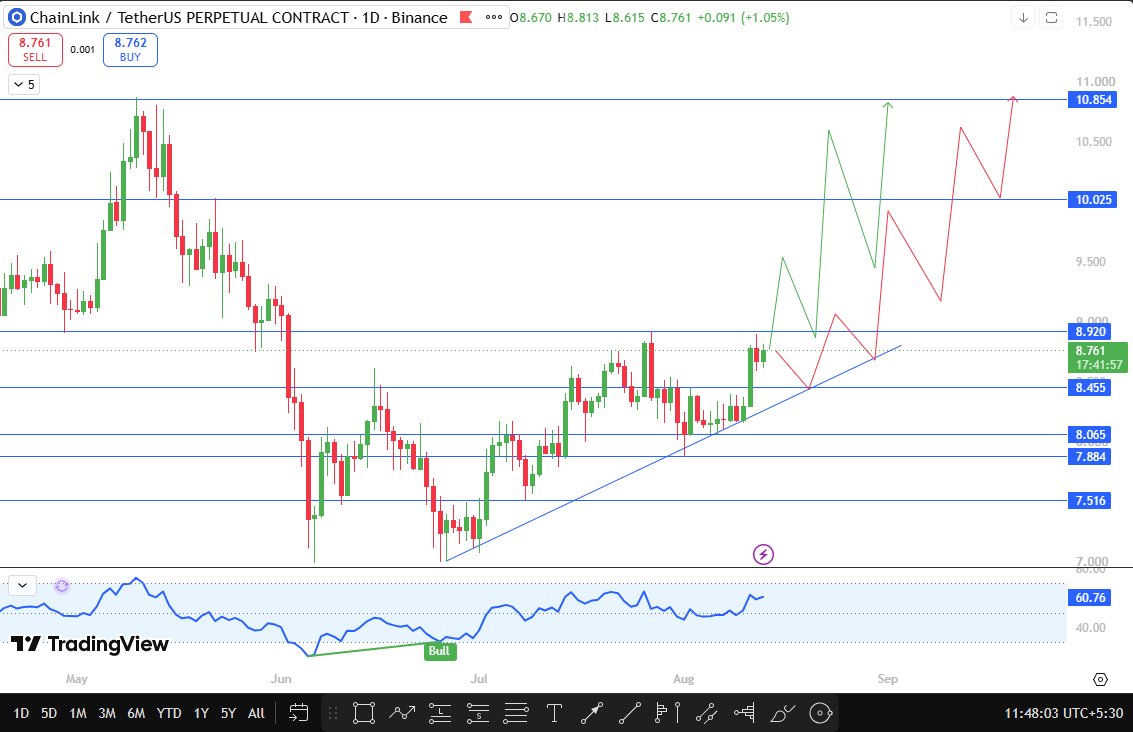
What makes this moment notable for this Chainlink technical analysis is not the climb itself, but what is happening right at the top of it.
Price has pushed up into a resistance zone that has capped LINK before, and instead of getting turned away quickly the way it has in past attempts, LINK is actually sustaining here.
That kind of stubborn hold near resistance is often the setup that precedes a genuine breakout, though it is not a guarantee on its own.
A daily close above 8.920, sitting roughly 1.81% above CMP, would be the confirmation this Chainlink price forecast is looking for. From there, 10.025 becomes the next short-term target, about 14.43% higher, followed by 10.854 near 23.89% above CMP if momentum carries through cleanly.
On the downside, the ascending trendline itself remains the first real cushion beneath price.
A daily close below 8.065, roughly 7.94% under CMP, would suggest the resistance hold has failed and sellers are stepping back in.
Below that, 7.884 becomes the next support, about 10.01% lower, and a further slip toward 7.516, close to 14.2% under CMP, would be the deeper test of whether this broader uptrend is still intact.
Chainlink Technical Outlook Snapshot
Indicator | Signal |
Price Structure | Ascending trendline intact, price sustaining at resistance rather than rejecting |
Momentum Oscillator RSI | Reading near 60.76, a recent Bull tag is visible near the June low |
Immediate Bias | Cautiously bullish above 8.920 |
Bullish Trigger | Daily close above 8.920 |
Bearish Trigger | Daily close below 8.065 |
Invalidation | Daily close below 7.516 |
Chainlink Support and Resistance Levels to Watch
Type | Level | Note | % From CMP |
Resistance | $10.854 | Short-term extended target | +23.89% |
Resistance | $10.025 | First breakout target | +14.43% |
Resistance | $8.920 | Immediate resistance, breakout trigger | +1.81% |
Current Price | $8.761 | Live CMP | 0% |
Support | $8.065 | Trendline breakdown trigger | -7.94% |
Support | $7.884 | Recent swing low support | -10.01% |
Support | $7.516 | Deeper invalidation level | -14.2% |
LINK Risk-Reward Table
Case | Trigger | Target |
Bullish breakout | Daily close above 8.920 | 10.025, then 10.854 |
Bearish breakdown | Daily close below 8.065 | 7.884 |
Deeper breakdown | Daily close below 7.884 | 7.516 |
Setup invalidation | Daily close below 7.516 | Broader uptrend structure at risk |
Invalidation Level
This Chainlink price prediction treats a daily close below 7.516 as invalidation for the current bullish structure.
Below that level, the case for LINK's broader ascending trendline still holding weakens considerably, and the setup would need a full reassessment.
Trading around any of these zones on leverage carries genuine risk.
False breakouts above 8.920 or false breakdowns below 8.065 are both possible before either level truly confirms, and the liquidation data above shows how quickly overleveraged positions can get wiped out during these swings.
How Bitcoin Could Influence Chainlink
Bitcoin sentiment remains a relevant factor for this LINK crypto forecast.
A stable or rising Bitcoin would likely give LINK more room to clear 8.920 and build toward 10.025 and 10.854.
A risk off shift in Bitcoin, on the other hand, would make a break below 8.065 more likely even with LINK's resistance hold looking resilient right now.
Planned Update
This Chainlink price prediction will be revisited if LINK closes a daily candle beyond either 8.920 or 8.065, or if no clear resolution happens within the next 24 to 48 hours.
Any major update on the Standard Chartered target commentary or a large liquidation event would also be reason enough to update this Chainlink technical outlook sooner.
Glossary
Ascending Trendline: A rising support line connecting a series of higher lows, used to track an uptrend's structure.
Open Interest: The total value of outstanding futures or perpetual contracts that remain open and unsettled.
Liquidation: The forced closing of a leveraged position by an exchange once losses erode a trader's required margin.
Resistance Zone: A price area where selling pressure has historically been strong enough to stop or reverse an advance.
Invalidation Level: The price point at which a technical outlook is no longer considered valid, requiring the setup to be reassessed.
CoinGabbar's Technical Analyst View
Bull Case: Price closes a daily candle above 8.920, confirming the resistance zone has finally given way, and momentum carries price toward 10.025 and potentially 10.854.
Base Case: Price continues to sustain near resistance without a decisive close above 8.920 or below 8.065, leading to a choppy, range-bound stretch as the market waits for confirmation.
Bear Case: Price closes below 8.065, breaking its recent resistance hold, and slides toward 7.884, with a further close below that level opening the door to 7.516.
Disclaimer
This Chainlink price prediction is prepared for informational purposes only and should not be treated as financial or investment advice. Cryptocurrency markets, including LINK, are highly volatile, and leveraged trading carries significant risk of loss, including liquidation as shown in the data above. Readers should conduct their own research and consult a qualified financial advisor before making any investment decisions. CoinGabbar and the analyst preparing this piece do not hold a position at the time of publication.
Also read:

















