Curve DAO Price Prediction August 2026: $CRV Breakout Watch

CRV has spent weeks getting squeezed tighter on two separate timeframes at once. That rarely lasts long. Is this coin about to break out, or is this just the pause before another leg down? Here's what the charts, the wallets, and Curve's own treasury moves are actually saying right now.
Why CRV Is Sitting At A Make-Or-Break Level
This Curve DAO price prediction matters because CRV trades at $0.2077, down 1.2% over the past day, boxed inside a daily symmetrical triangle and a much bigger weekly descending triangle at the same time.
Both patterns are running out of room. When two triangles converge like this, the next move tends to be sharp, not slow.
Neither RSI reading looks stretched, though. Daily RSI sits at 48.13 and weekly at 39.78, both closer to neutral than extreme. So this isn't a story about an overheated coin cooling off.
It's a coin sitting quietly at a decision point. What actually happens next?
Why CRV Is Moving Today
There's no single dramatic headline here. Curve Finance's own account confirmed its treasury now holds DOLA as sDOLA, calling it a core reserve asset. Inverse Finance called it one of the strongest endorsements DOLA has received.
That's treasury diversification news, not a price-pump trigger. It lines up with a separate weekly yield update, showing select pools yielding anywhere from 19% to past 100%, a sign the protocol stays active even while the token drifts.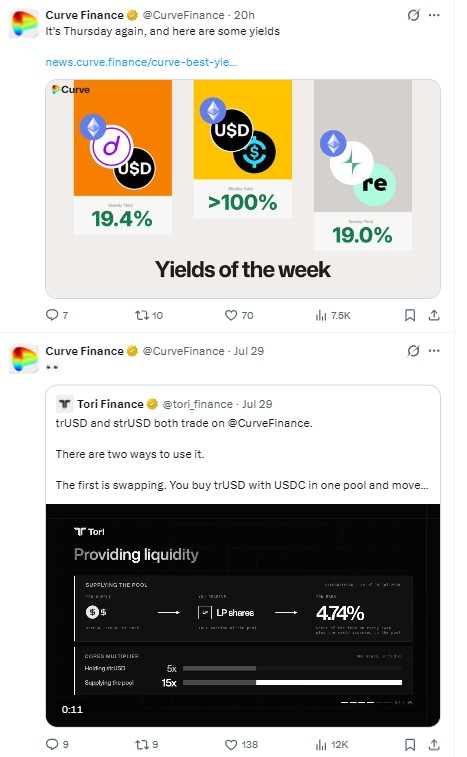
Liquidations stayed small. Over 24 hours, CRV saw just $15.58K wiped out, almost all of it in longs, per exchange data. No short squeeze here, unlike some louder altcoins this week.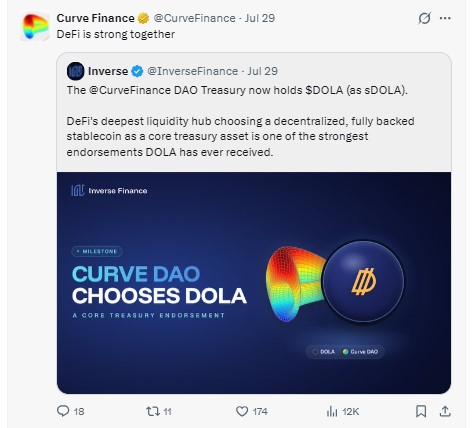
For wider sector context, our crypto news today coverage tracks how the rest of the market is trading around this move.
Daily Chart Analysis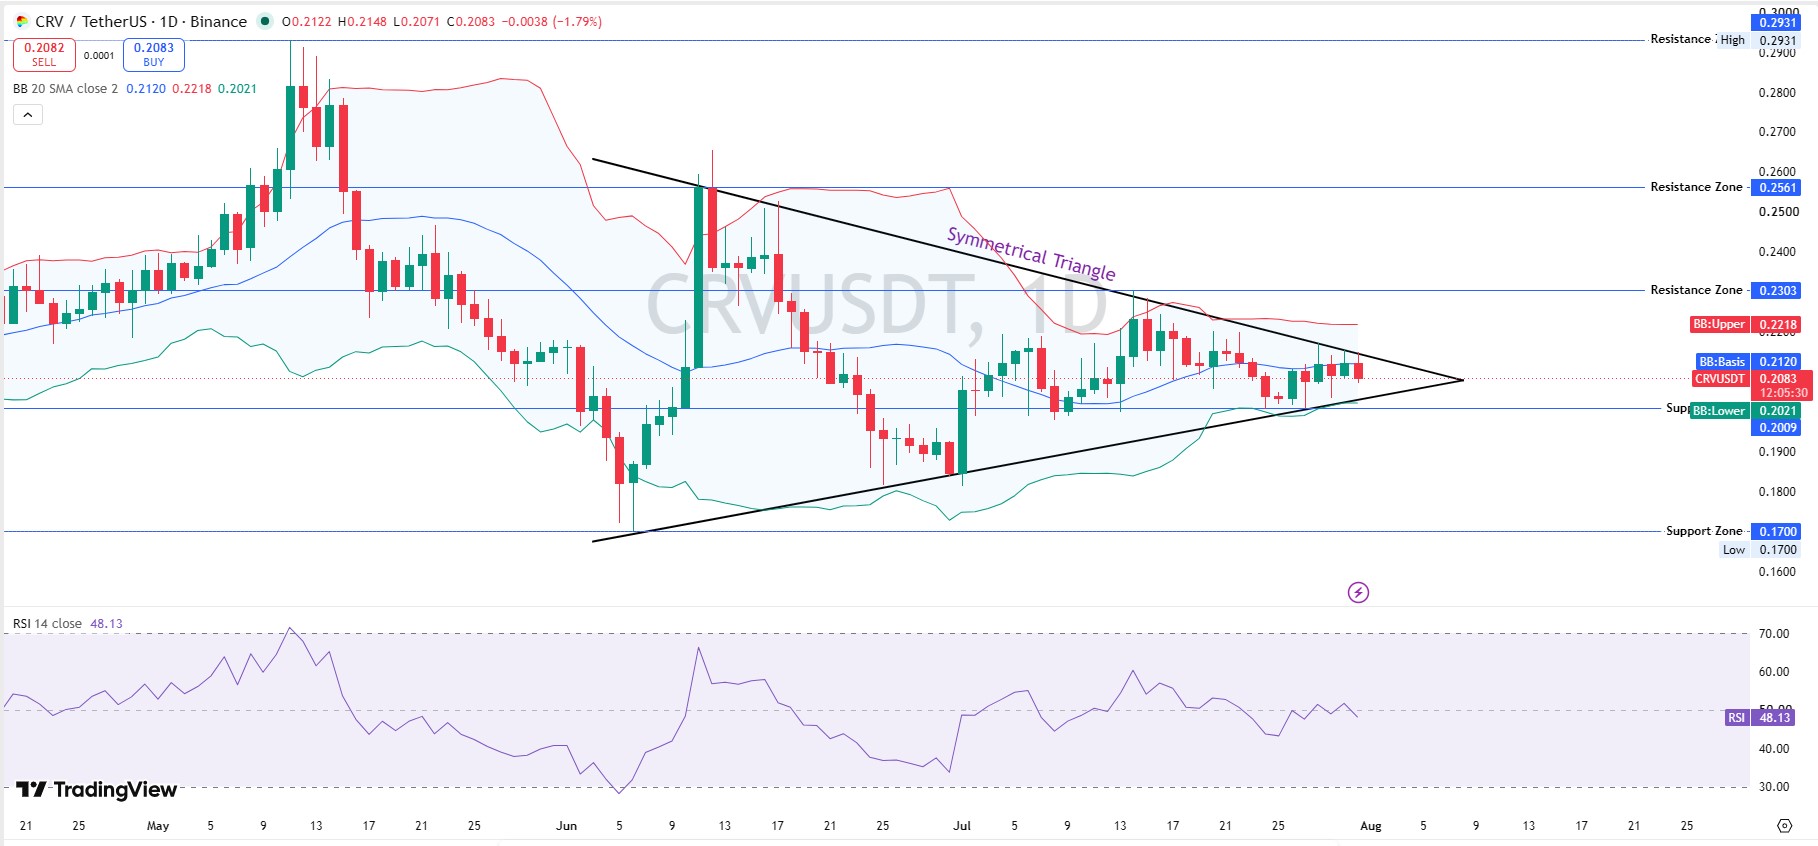
On the daily chart, CRV closed at $0.2083, down 1.79% on the candle, inside a symmetrical triangle tightening since June. Price sits between the 20-period Bollinger basis at $0.2120 and the lower band at $0.2021.
Daily resistance zones stack at $0.2303, then $0.2561, then a high near $0.2931. Support sits at the $0.1700 zone.
RSI at 48.13 gives no strong lean either way. The triangle apex is close now, which usually forces a decisive daily close through one boundary soon.
Weekly Chart Analysis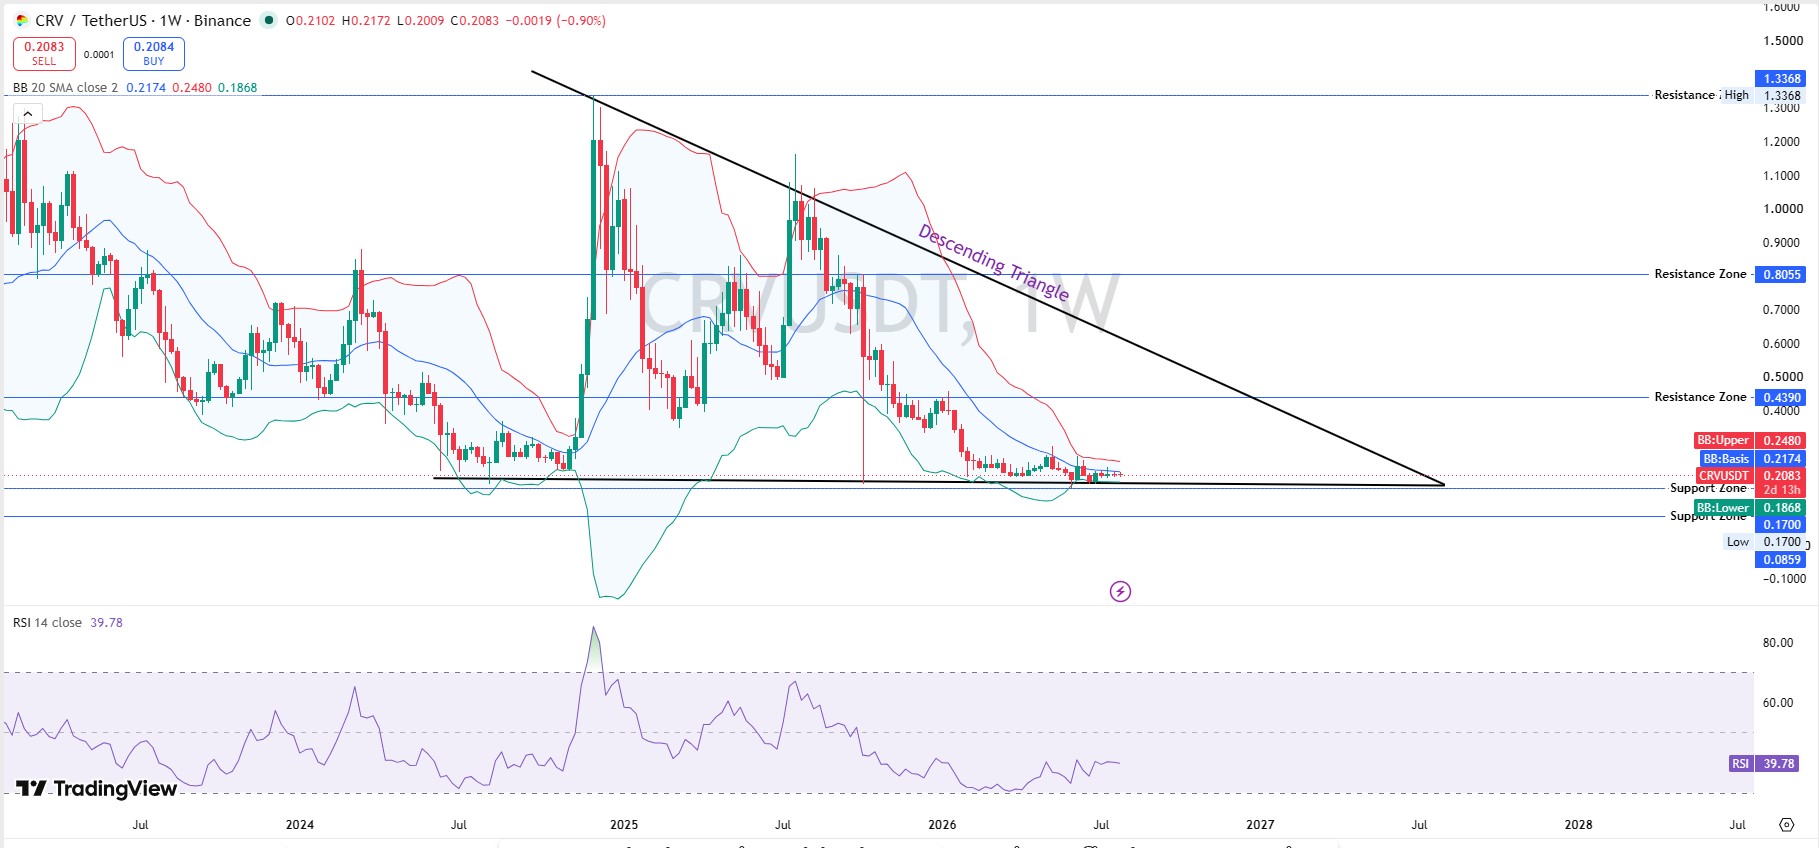
Zoom out, and the picture gets heavier. CRV's weekly chart shows a descending triangle stretching back years, with lower highs pressing against a flat support zone near the current price.
Weekly resistance sits far overhead at $0.4390, $0.8055, and a distant high of $1.3368. Weekly support drops to $0.1868, then $0.0859 if the floor breaks.
Weekly RSI at 39.78 leans soft, not oversold. A confirmed break of this multi-year triangle, in either direction, would carry more weight than the daily pattern alone. For a similar setup in the other majors, see our bitcoin price prediction 2026 breakdown.
CRV Support And Resistance Levels
Immediate support: $0.2021 (daily BB lower), then $0.1868, then $0.1700. Immediate resistance: $0.2120 (daily basis), then $0.2303, then $0.2561.
A daily close back above $0.2120 eases near-term pressure. A close under $0.1868 confirms the weekly triangle is breaking down, not out. Our ethereum price prediction 2026 piece covers how a similar level break played out for ETH.
Tokenomics And Whale Concentration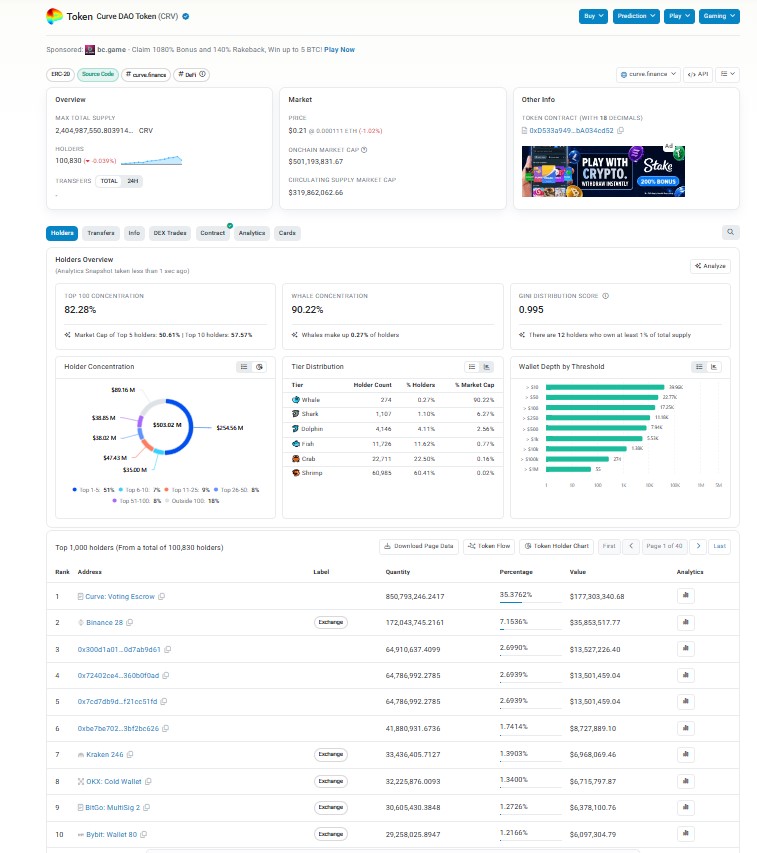
CRV's circulating supply sits near 1.53B tokens against a 3.03B max supply, per CoinMarketCap, giving a fully diluted value of $629.61M against a $318.9M market cap.
Concentration runs severe: top 100 wallets hold 82.28% of supply, and whale wallets, just 0.27% of holders, control 90.22% of market cap. The Gini score reads 0.995.
But the top wallet isn't a seller waiting to dump. It's Curve's own contract, the Voting Escrow, holding 35.38% ($177.3M) in locked veCRV, not a free-floating supply. Binance's wallet ranks second at 7.15%.
Anyone tracking token vesting elsewhere can check our coin events calendar for unlock schedules across other assets.
Where CRV Is Actually Trading
Binance carries the largest share of CRV futures volume at $10.81M, per Coinglass data, followed by WhiteBIT near $5.62M and OKX around $4.17M.
That's a modest derivatives footprint against CRV's market cap, nowhere near the leverage-heavy setups seen on smaller-cap tokens this week. Fresh pairs and listings are worth tracking on our crypto exchange listing page.
CRV Price Prediction: Scenarios By Timeframe
Timeframe | Bull Case | Base Case | Bear Case |
24H | Reclaims $0.2120, tests $0.2303 (moderate) | Chops between $0.202-$0.212 (high) | Slips under $0.2021 toward $0.1868 (low) |
7D | Daily close above $0.2303 opens $0.2561 (low-moderate) | Range-bound inside the triangle (high) | Weekly close under $0.1868 confirms breakdown (moderate) |
Aug 2026 | Triangle resolves up, targets $0.2561-$0.2931 (low-moderate) | Drifts $0.18-$0.23 tracking DeFi sentiment (moderate) | Breaks $0.1700, retests the $0.0859 zone (low) |
Invalidation for the bullish case is a daily close under $0.2021. A weekly close under $0.1868 would be the deeper warning sign.
CRV Market Outlook: Risks To Watch
Whale concentration tops the list, even with the veCRV nuance factored in. A Gini score of 0.995 doesn't disappear just because the largest wallet is a locking contract.
Two converging triangles also mean volatility is likely coming in either direction. And the DOLA treasury news, genuinely positive, isn't the kind of catalyst that moves price on its own.
This Curve DAO price prediction leans neutral-to-cautious in the near term and turns bullish only on a confirmed break above resistance. Airdrop-driven demand elsewhere in DeFi can shift sentiment fast too, something our crypto airdrops tracker keeps an eye on.
Methodology
Chart levels came from CRV/USDT daily and weekly charts on Binance via TradingView, using RSI-14 and 20-period Bollinger Bands, captured on July 31, 2026, around 05:30 UTC. Price, supply, and market-cap data came from CoinMarketCap. Holder concentration and Gini score came from on-chain token-holder analytics, cross-checked on Etherscan. Liquidation and futures-volume data came from Coinglass. Treasury and yield updates came from Curve Finance's official account on X.
Disclaimer: This is speculative market commentary, not financial or investment advice. Crypto assets are volatile and can lose most or all of their value. Data is current as of July 31, 2026; verify live figures before trading.











.jpg)






