Stacks Price Prediction August 2026: Can $STX Stage a 2700% Comeback?


Stacks has been beaten down for a long time, and this stacks price prediction August 2026 lands right at the point where the chart is finally showing signs of life.
$STX is trading at $0.1382, up 3.1% today, sitting right where a multi-year downtrend line and a shorter-term channel are both getting tested at once.
Stacks Price Today: Live Data and 24-Hour Change
$STX is currently trading at $0.1382 right now, up 3.1% over the past 24 hours, after moving through a range of $0.1343 to $0.1422.
Market cap sits at $256.766M, with a fully diluted valuation almost identical at $256.768M basically no gap at all, since circulating and total supply are the same number. 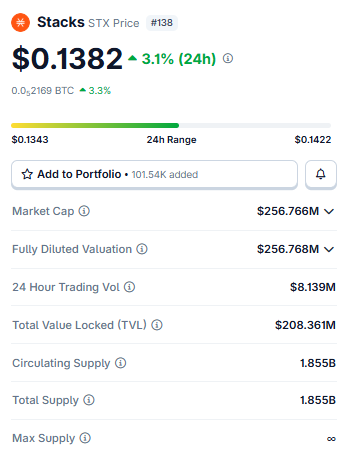
Source: $STK Market Cap Data Taken From Coingecko, data as of July 31, 2026. Figures may vary slightly across other tracking websites.
Total value locked on the network comes in at $208.361M, which is a decent size relative to the market cap itself. 24-hour trading volume was $8.139M.
Circulating supply and total supply both sit at 1.855B STX, and max supply is uncapped.
With no meaningful gap between what's circulating and what's out there, unlock pressure isn't really a factor in this stack price prediction August 2026; it's almost entirely a chart story right now.
Technical Analysis: Key Support and Resistance Levels
$STX is trading near an important technical zone, where trend direction could soon be decided. The daily chart helps identify the levels that may act as support during pullbacks or resistance during rallies.
Stacks Daily Chart Analysis: Descending Channel
The daily chart shows $STX sliding lower inside a clean descending channel for weeks. 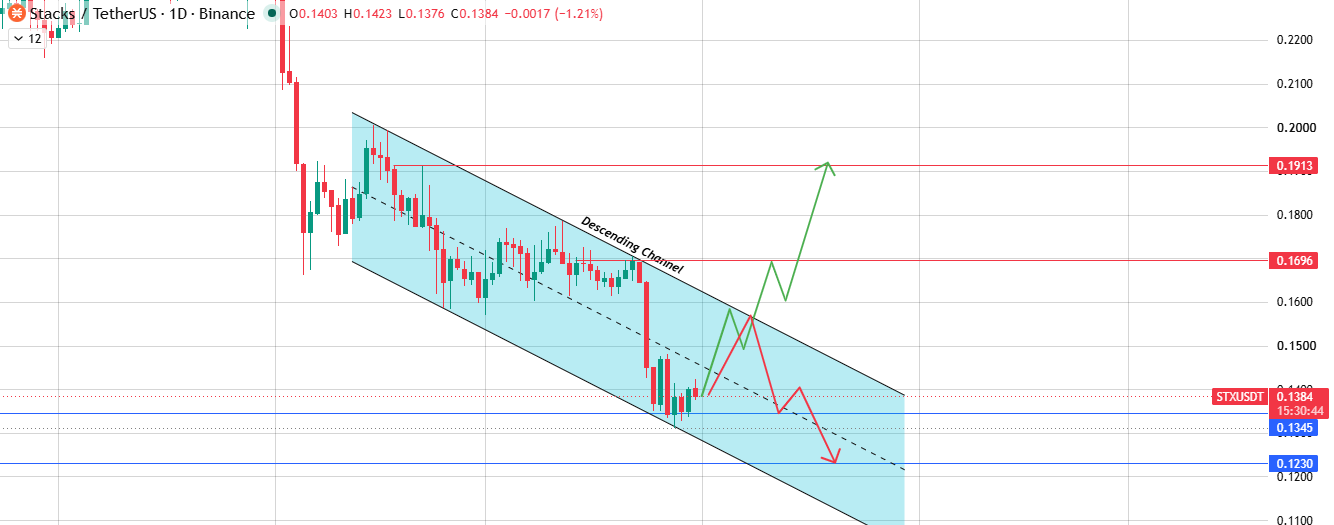
Source: Chart Taken From TradingView.
Price is currently sitting near the middle of that channel, trying to work its way back toward the upper boundary.
Break above the channel with decent volume, and resistance sits at $0.1696 first, then $0.1913 if buyers keep coming.
If the channel holds instead and sellers stay in control, support at $0.1345 is the level to watch, with $0.1230 next if that gives way too.
Stacks Weekly Chart: The Big Trendline Test
Zoom all the way out, and the weekly chart tells a much bigger story.
$STX previously ran an incredible 2,710.86% during a historic stretch, backed by volume north of 16.5 billion at the time. 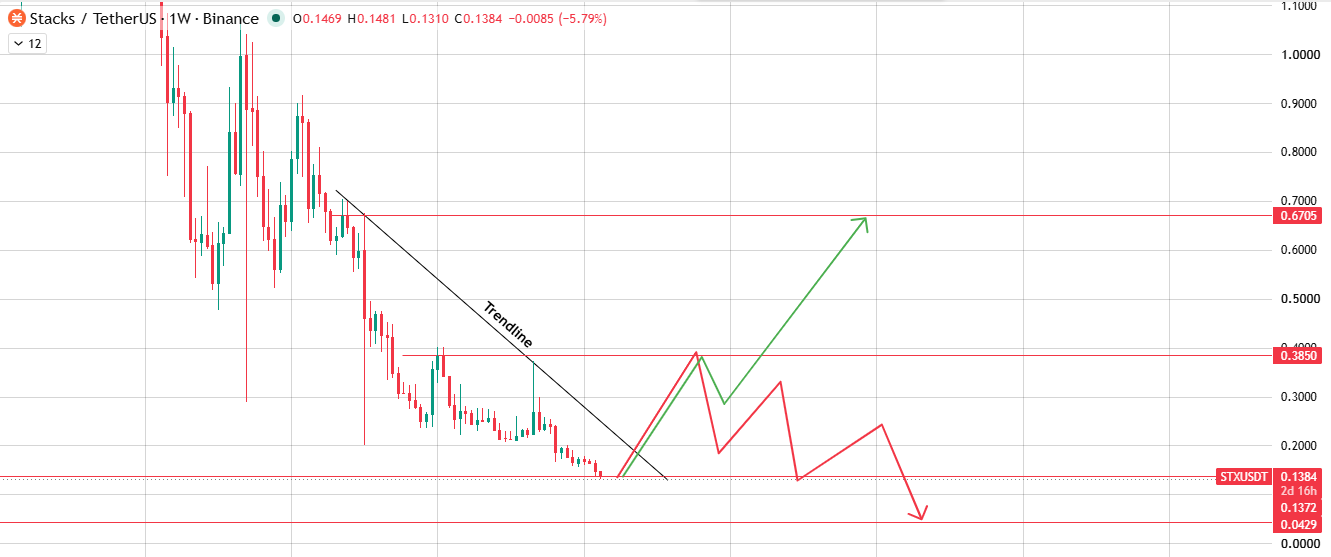
Source: Chart Taken From TradingView.
Since that peak, price has spent years grinding lower, and it's now sitting right at a descending trendline that's held every bounce back down since.
Break above that trendline with real conviction, and $0.3850 becomes the first serious target, with $0.6705 next if momentum really builds behind it.
Fail to break it, or lose the current support zone instead, and the drop could extend toward $0.1372, with the much deeper $0.0429 level as the worst-case outcome if the long downtrend simply continues.
Stacks Price Prediction August 2026: Bull, Base, and Bear Cases
Here's the thing that makes this stack price prediction August 2026 worth paying attention to:
$STX once ran over 2,700% during a single historic stretch years ago, and the price has spent most of the time since grinding back down toward levels not far from where that whole move started.
It's now testing a long-term trendline that's capped every bounce for a long time.
| Scenario | Target | Invalidation Level |
|---|---|---|
| Bull | $0.1696 – $0.1913 (Daily) $0.3850 – $0.6705 (Weekly) | Rejection at the trendline: the price fails to hold the descending channel. |
| Base | $0.1345 – $0.1696 (Range-Bound) | Confirmed close outside either boundary. |
| Bear | $0.1230 (Daily) $0.1372 – $0.0429 (Weekly) | Breakdown below the daily channel and weekly trendline. |
For the bullish version to actually happen, $STX needs to break both its daily channel and that long-standing weekly trendline with real volume behind it.
Pull that off, and $0.1696 is the first stop on the daily chart, then $0.1913, with the weekly chart's much bigger targets of $0.3850 and $0.6705 opening up further out if the move genuinely has legs.
The base case is far less exciting; $STX just stays stuck chopping around in this general zone without confirming anything either way.
August 2026 Catalysts That Could Move Stacks
Bitcoin layer activity, ongoing developer work on the Stacks ecosystem, and how TVL trends this month are the main $STX-specific things worth watching.
Beyond that, whether $STX can actually clear its daily channel and test that long-term weekly trendline with real volume is probably the single biggest thing that could shift sentiment, alongside how the broader altcoin market is behaving.
What Analysts Are Forecasting (Stacks)
Is Stacks a good investment right now? That mostly comes down to whether you believe a multi-year downtrend line is actually about to break or whether STX just bounces off it again like it has before.
A confirmed weekly close above the trendline, especially with volume picking up from its current modest levels, would be a genuinely meaningful signal given how long this trendline has held.
A rejection here would suggest the downtrend still has control.
This is chart-based analysis, not a promise of what happens next.
Stacks Long-Term Outlook: 2027 to 2030
If STX clears its daily channel and breaks the weekly trendline this year, a longer climb toward $0.3850 and potentially $0.6705 looks like a reasonable stretch target across 2027 and 2028.
What Stacks is actually worth by 2030 will depend a lot more on real Bitcoin layer adoption and TVL growth than on any single chart level, but the current setup at least gives a meaningful starting point.
Risks That Could Invalidate This Forecast (Stacks)
The clearest risk is another rejection at this same weekly trendline, which has held for a long time now.
That would open the path toward $0.1372, and if support really gives way, the deeper $0.0429 level becomes the worst-case target on the weekly chart.
Given how low current volume is at $8.139M, a low-conviction breakout that quickly fails wouldn't be a surprise if broader market sentiment doesn't cooperate.
Disclaimer: This stacks price prediction is for informational and educational purposes only and should not be considered financial or investment advice. Cryptocurrency markets are highly volatile, and prices can change rapidly. Always conduct your own research and consult a qualified financial advisor before making any investment decisions.











.jpg)






