Decred Price Prediction: Why Is DCR Price Surging Today?


Something unusual just happened with a coin most traders had stopped watching. Decred went from quiet to loud in less than a day, and the chart is now telling a story nobody was pricing in this week. What changed, and does it actually hold up?
Decred Price Prediction Today: What Triggered This Sudden Move
Decred price prediction chatter is spiking today, and it's not hard to see why. The coin jumped hard in the last 24 hours, catching a lot of sideline traders off guard.
Turns out, DCR had been coiling quietly for weeks. Basically, the market was building pressure without anyone paying attention.
And then it snapped. Fast, sharp, and loud enough that volume charts lit up almost instantly.
We pulled up the volume data first, and the jump was hard to ignore. It wasn't a slow grind; it was a spike.
But is this the start of something bigger, or just a fast reaction that fades? Part of the answer ties back to why the broader crypto rally has been picking up steam this week too.
Decred Coin Overview and Today's Trading Snapshot
| Metric | Value |
|---|---|
| Coin Name | Decred |
| Ticker Symbol | DCR |
| Blockchain | Decred Network (Own Chain) |
| Today High | $15.42 |
| Today Low | $11.00 |
| RSI Level | 89.44 |
| Token Type | Native Coin |
| Token Category | Layer 1, Governance |
| Market Cap | $252.08M |
| 24H Trading Volume | $12.21M |
| 24H Trading Volume Change | +635.8% |
| Circulating Supply | 17.5M DCR |
| 24H Change | +30.68% |
Source: Data by CoinMarketCap
Why Decred Is Suddenly Back In The Conversation
This isn't hype without substance. Decred's on-chain voting system is active right now, with thousands of tickets locked and real participation happening block by block.
Over 63% of the circulating supply is currently staked into the ticket system.
The network's treasury is funded directly on chain, which means development doesn't depend on a single company staying solvent. That's a structural point bulls keep bringing up.
Decred Technical Price Analysis: Reading The Breakout
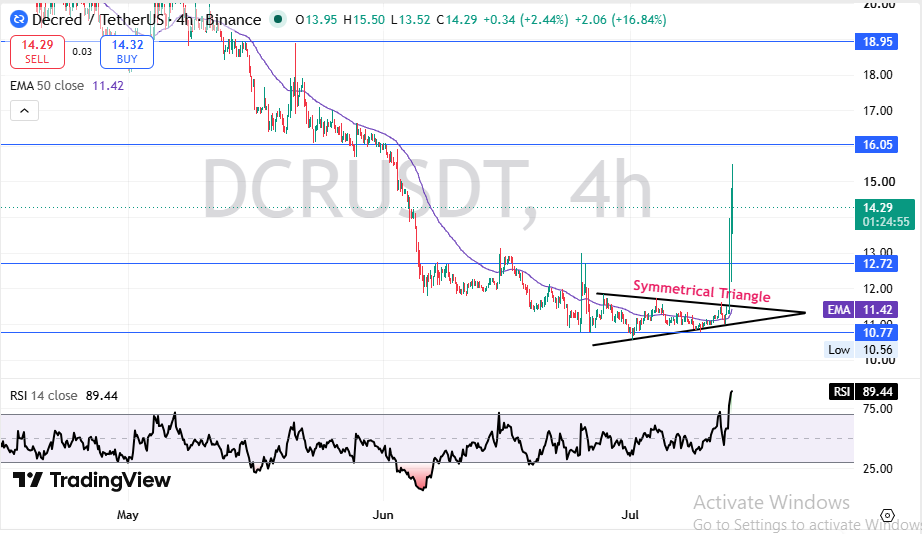
Price didn't just drift up; it broke out of a tightening range that had been forming since June. That range is what traders call a symmetrical triangle, basically a coiled spring on the chart.
Source: Charting by TradingView
The 50 EMA sits near $11.42, well below the current price, and that gap shows how far the price stretched in a short window. RSI at 89.44 is deep into overbought territory: exactly the kind of reading that often precedes a cooldown.
Support now sits near $12.72, with a deeper floor around $10.56. A close below $10.77 would undo the bullish structure entirely.
Short-Term Decred Price Prediction For The Coming Days
The next week likely decides whether this breakout sticks or sells out.
| Timeframe | Bearish Target | Base Target | Bullish Target | Key Trigger |
|---|---|---|---|---|
| 24 Hours | $12.72 | $14.50 | $16.05 | RSI cooldown vs fresh volume |
| 3–7 Days | $11.90 | $15.20 | $18.95 | Weekly close above triangle top |
| 2–4 Weeks | $10.77 | $14.80 | $20.00 | Sustained volume follow-through |
Watch the volume bars closely.
Long-Term Decred Price Prediction Heading Into Next Year
Zooming out, the long-term case depends on whether this staking-driven demand is structural or just a one-time spike, not unlike the ongoing Bitcoin bull bear case debate playing out across the wider market.
| Timeframe | Bearish Target | Base Target | Bullish Target | Catalyst Needed |
|---|---|---|---|---|
| 3 Months | $9.50 | $16.00 | $22.00 | Continued ticket demand |
| 6 Months | $8.00 | $18.00 | $28.00 | Exchange volume staying elevated |
| End of Year | $7.50 | $20.00 | $35.00 | Broader altcoin season returning |
| 2027 Outlook | $6.00 | $24.00 | $45.00 | Renewed developer activity and adoption |
Honest take: the long-term case is interesting but not proven yet. It needs more than one green week to convince skeptics.
Three Decred Price Scenarios Traders Are Weighing Right Now
Worst Case: Price rejects near resistance and slides back under $10.77, erasing most of this move. Anyone tracking crypto price predictions in this cycle knows how fast that kind of reversal can happen.
Base Case: DCR consolidates between $12.72 and $16.05 while the market digests the spike.
Best Case: Volume holds, resistance at $16.05 breaks, and price pushes toward $18.95 and beyond.
| Scenario | Price Range | What Triggers It |
|---|---|---|
| Worst Case | $6 - $10.77 | Breakout fails and sellers regain control. |
| Base Case | $12.72 - $16.05 | Sideways digestion following the recent spike. |
| Best Case | $16.05 - $20+ | Trading volume remains strong and key resistance levels are cleared. |
Key Decreased Price Levels Every Trader Should Watch
Resistance zone: $16.05 and then $18.95 above, both untested since the recent surge began. Levels like these matter more when sentiment is fragile.
Support zone: $12.72, the first level buyers are likely to defend on any pullback.
Invalidation zone: below $10.77, where the bullish structure would break down completely.
Decred Analyst View And Final Thoughts On DCR Right Now
When we pulled up the RSI, the first thing that stood out was just how stretched it looked. A reading above 85 rarely holds without some kind of pullback first.
But the chart structure underneath still looks constructive. Price is holding well above the 50 EMA, and that's not nothing.
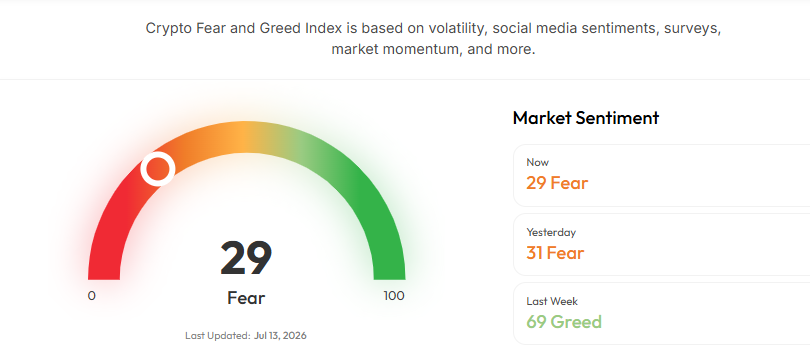
One thing worth tracking beyond the chart: overall market risk appetite, since altcoins this size tend to move with broader sentiment, not just their own news. The Fear and Greed Index sits at 29 right now, down from 31 yesterday and a sharp drop from 69 just last week, so this DCR surge is actually happening while the wider market leans toward fear rather than greed.
Source: By Coinstats
A weekly close above $16.05 would be the strongest signal yet that this move has legs. Anything below $12.72 would say the opposite.
The most important level right now is $12.72. Everything else is noise until that holds or breaks.
Momentum brought Decred back into the spotlight. Whether it stays there is still an open question.
DISCLAIMER: This article is for educational purposes only and does not constitute financial advice. Crypto markets are volatile. Consult your investment advisor before making any investment decision.
Also read:

















