ENS Price Prediction August 2026: Can ENS Hit $16 Next?


ENS price prediction august 2026 conversations are picking up as the chart starts hinting at something different.
ENS Price Today: Live Data and 24-Hour Change
$ENS is priced around $4.24, down 0.81% over the past 24 hours.
Market cap sits at $174.35 million, well below the unlocked market cap and fully diluted valuation of roughly $424.9 million, since a large share of supply is still locked.
Volume over the past 24 hours came in at $11.53 million, up 3.9%, putting the volume-to-market-cap ratio at 6.57% and the liquidity-to-market-cap ratio at 0.75%. Circulating supply is 41.02 million ENS out of a fixed total supply of 100 million, spread across roughly 67,790 holders.
Source: ENS live price data taken from CoinMarketCap, data as of July 31, 2026.
Holder Concentration and On-Chain Snapshot (ENS)
Ownership of ENS is heavily concentrated at the top.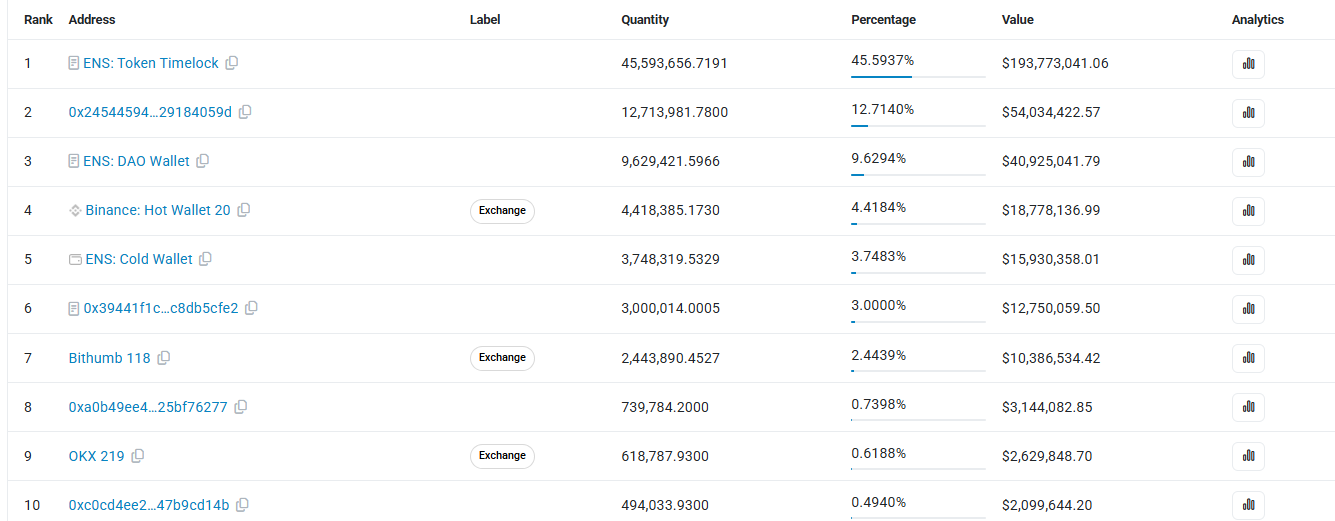
The single largest holder is the ENS Token Timelock contract, controlling 45.59% of supply, followed by an unlabeled wallet at 12.71% and the ENS DAO Wallet at 9.63%. Together, the top five addresses account for over 76% of the entire market cap.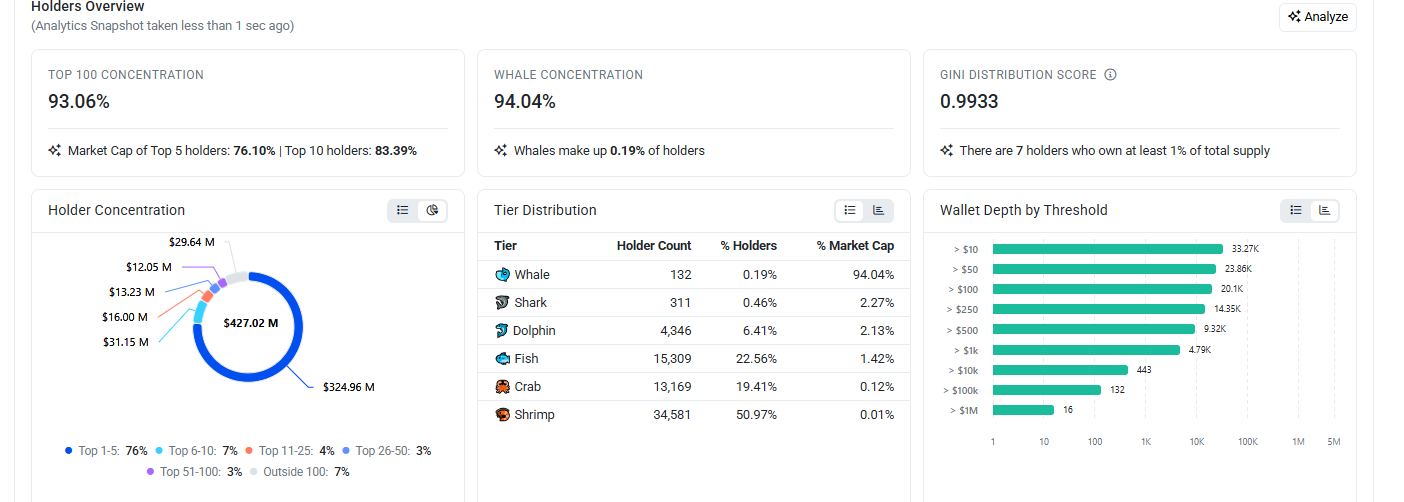
Exchange wallets also show up further down the list, with Binance Hot Wallet 20 holding 4.42%, Bithumb at 2.44%, and OKX at 0.62%. Broader concentration metrics tell a similar story: the top 100 addresses hold 93.06% of supply, whales make up just 0.19% of all holders yet control 94.04% of market cap, and only seven wallets each own at least 1% of total supply.
It's worth noting that a large portion of this concentration sits in the Token Timelock and DAO Wallet, which function more like protocol-controlled reserves than active sell-side supply, so this isn't the same as a handful of individuals holding outsized influence.
Source: ENS top holder addresses taken from Etherscan, data as of July 31, 2026.
Quick Take
CMP: $4.24 (-0.81% on the day)
Daily trigger: close above $4.74 opens $5.82 and then $8.16
Daily failure: close below $3.95 exposes $3, a psychological level
Weekly trigger: close above $8.119 opens $11.483 and then $16.074
Weekly failure: close below $3 exposes $2, a psychological level
Daily RSI: 44.40 | Weekly RSI: 34.52
Data as of July 31, 2026, IST
$ENS Technical Forecast August 2026
ENS has been respecting a descending trendline on the daily chart for weeks, with each touch of that line triggering fresh selling.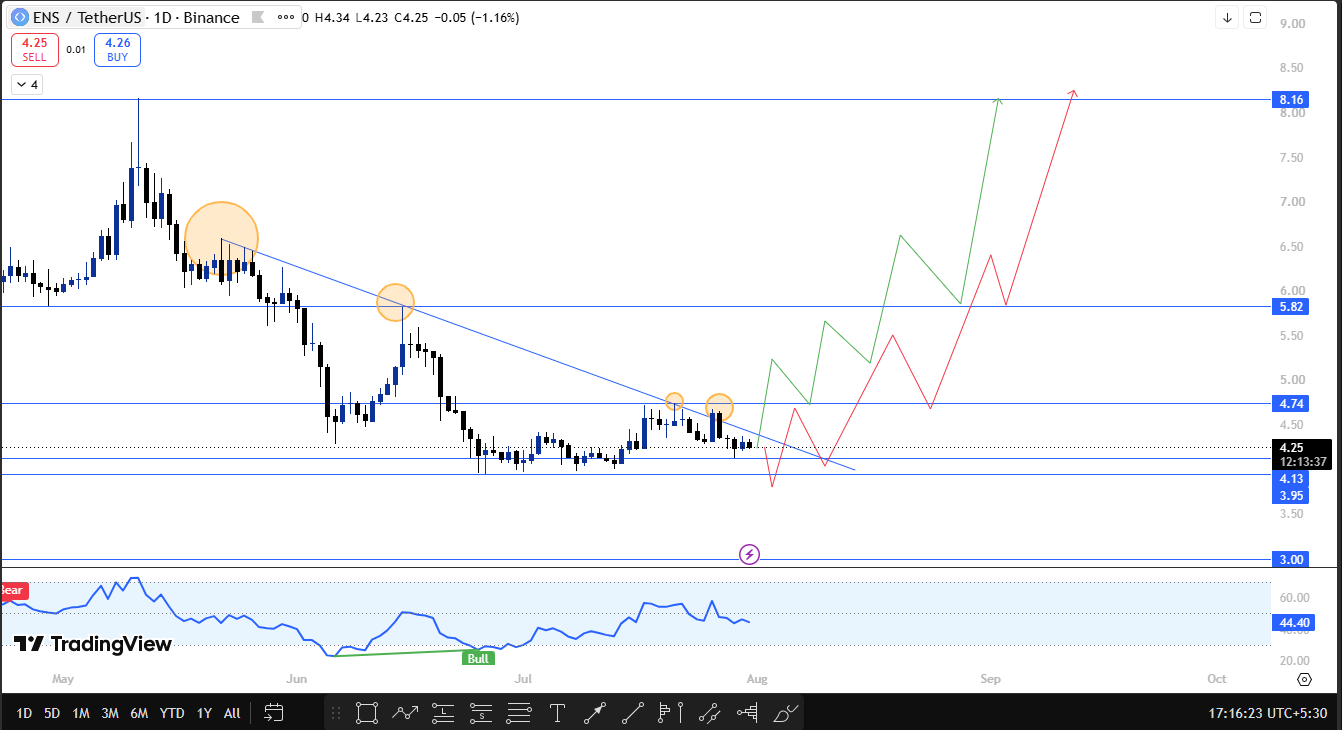
That pattern started to change on the third and fourth taps, though, where the selling pressure came in visibly weaker than before.
The fourth touch even produced an attempted breakout, though it largely failed to hold.
If ENS manages a daily close above $4.74, the next resistance zone opens at $5.82, followed by $8.16 further out. A close below $3.95 instead would put the $3 psychological level back in focus as the next support.
Source: ENS daily chart via TradingView, dated July 31, 2026, 17:16 IST.
Zooming out to the weekly chart, ENS is currently trading inside a falling wedge, with price showing signs of rejection off support and some buying interest stepping back in.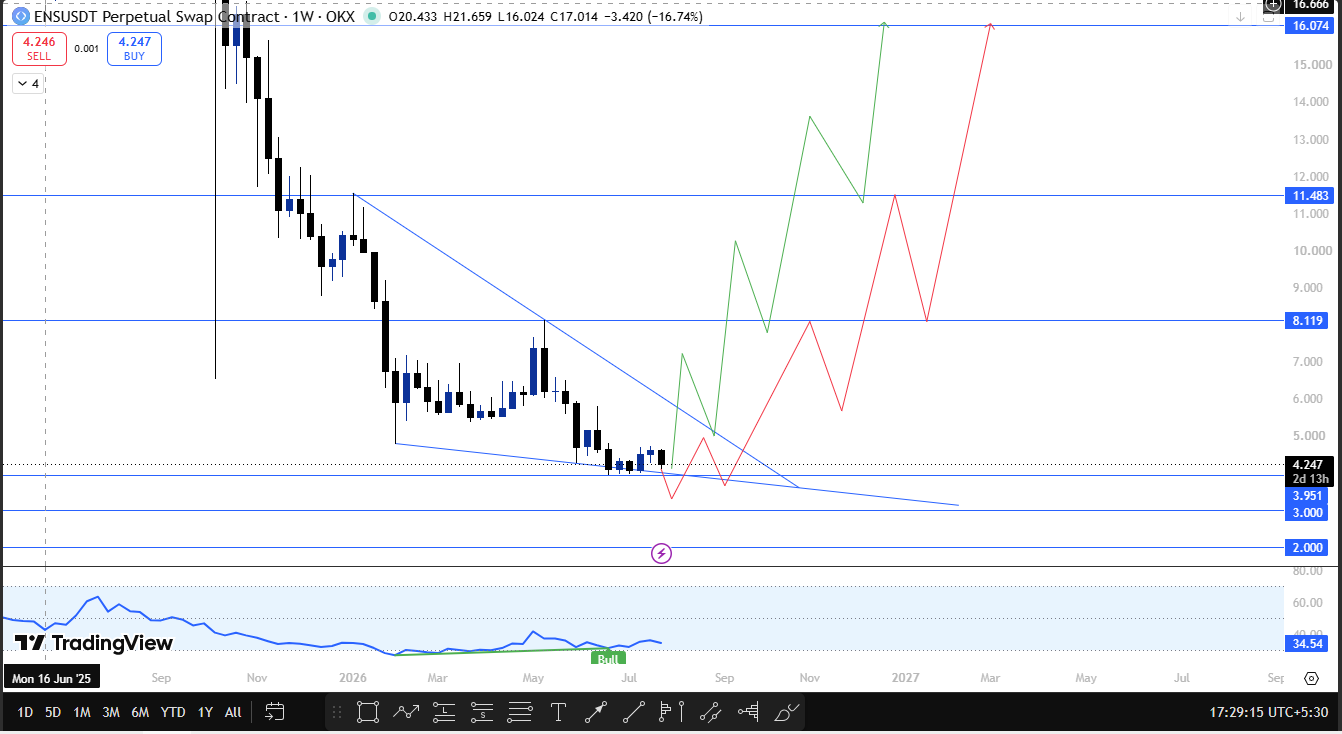
A confirmed weekly close above $8.119 would open $11.483, and then $16.074 as the resistance ladder above that. On the downside, a weekly close below $3 would shift attention to the $2 psychological level as the next support to watch.
Source: ENS weekly chart via TradingView, dated July 31, 2026, 17:30 IST.
Note: the support and resistance levels referenced throughout this analysis are based on prior swing highs and swing lows on their respective timeframes.
Technical Analysis: Key Support and Resistance Levels (ENS)
Timeframe | Resistance | Support | Trigger |
Daily | $4.74, $5.82, $8.16 | $3.95, $3.00 | Close above/below $4.74 / $3.95 |
Weekly | $8.119, $11.483, $16.074 | $3.00, $2.00 | Close above/below $8.119 / $3.00 |
$ENS Price Prediction for August 2026: Bull, Base, and Bear Cases
The base case for August has ENS continuing to move inside the weekly falling wedge while the daily chart works through its recent softer rejections, without a confirmed break on either timeframe yet.
The bull case needs a daily close above $4.74, which opens $5.82 and then $8.16, and carries more weight if the weekly candle also clears $8.119 for a run toward $11.483 and $16.074.
The bear case activates on a daily close below $3.95 and turns more serious if the weekly candle closes below $3, which would put the $2 psychological level in play next.
As with any of these scenarios, what matters is a confirmed close on the relevant timeframe rather than a brief wick through the level.
Readers comparing this setup against other tokens can browse the full price prediction section for similar breakdowns.
What Analysts Are Forecasting ($ENS)
Opinion on ENS is split along fairly predictable lines right now.
One side points to the weakening selling pressure on the last two daily trendline touches, plus the rejection and buying interest showing up on the weekly falling wedge, as early signs of exhaustion in the downtrend.
The other side notes that weekly RSI at 34.52 is still well under neutral and that a failed breakout attempt on the daily chart isn't the same as a confirmed reversal.
Neither camp has been proven right yet. Both are watching the same trigger: a decisive close outside the current range on the higher timeframe.
ENS Long-Term Outlook: 2027 to 2030
If ENS eventually clears the weekly resistance ladder at $11.483 and $16.074, that would represent a significant shift in its longer-term structure. Getting there depends on the $3 weekly support holding first, since a breakdown below that level would push any such move much further out.
The heavy concentration of supply in the Token Timelock and DAO Wallet is also worth watching over a longer horizon, since how that locked supply eventually unlocks and gets deployed could shape ENS's trajectory well beyond August. Any related protocol milestones are usually flagged in advance on the coin events calendar.
Risks That Could Invalidate This Forecast ($ENS)
The bullish case fails if the daily chart can't close above $4.74 and weakens further if the weekly candle closes below $3, opening the path toward $2.
Broader risks include shifts in Bitcoin dominance, changes in overall market liquidity, and general crypto volatility, any of which could override ENS's own chart structure.
Staying updated through ongoing crypto news can help contextualize any sudden moves outside these technical levels.
Given how concentrated ownership is among a small number of wallets, any large-scale movement from the top holders is also worth monitoring independently of the technical setup.
How to Buy and Store ENS Safely
ENS can be bought on major exchanges that list spot markets for the token, and checking a current crypto exchange listing page is a good starting point before choosing where to buy.
Once purchased, moving it to a personal wallet rather than leaving it on an exchange long-term reduces counterparty risk.
A hardware wallet is generally the safer option for larger holdings, and two-factor authentication should be enabled on any exchange account regardless of position size. Holders who like to track extra opportunities can also keep an eye on ongoing crypto airdrops from time to time.
Glossary
Descending trendline: a downward-sloping line connecting a series of lower highs, used to track a prevailing downtrend
Falling wedge: a converging chart pattern with lower highs and lower lows that narrows over time, often resolving with a breakout
Swing high / swing low: notable price peaks or troughs formed before a temporary reversal, often used as structural reference points for support and resistance
RSI (Relative Strength Index): a momentum indicator scaled 0-100, where readings below 50 suggest weaker momentum and above 50 suggest stronger momentum
Whale concentration: the share of total market cap held by the largest wallet holders of a token
Psychological level: a round number that often acts as a support or resistance zone simply because traders watch it closely
Invalidation level: the price point at which a forecast scenario is considered incorrect
Disclaimer: This article is for informational purposes only and does not constitute financial advice. Cryptocurrency markets are highly volatile, and all price levels discussed are based on technical chart analysis, not a guarantee of future performance. Readers should conduct their own research before making any investment decisions.











.jpg)






