The Sandbox Price Prediction August 2026: Can SAND Break Downtrend?


The Sandbox is laying out a bigger role for LAND as its studio moves toward a planned Q4 2026 public launch, with more monetization tools and a rebuilt isometric map on the way.
$SAND, meanwhile, enters August 2026 still trading beneath its daily descending trendline after a long slide.
That contrast sits behind this: The Sandbox Price Prediction August 2026: Does an expanding LAND ecosystem give the token room to recover, or does the chart still call the shots? 
The early read is NEUTRAL TO BEARISH the setup can improve if SAND clears its immediate resistance, but the technical backdrop remains weak.
Could Greater LAND Utility Give The Sandbox a Fresh Narrative?
The Sandbox says LAND is set to gain more utility as its studio heads toward a Q4 2026 public launch: stronger game visibility, more monetization options, and eventually LAND owners running their own publishing operations and curating other creators' games.
The map is also being rebuilt in isometric 3D for easier discovery.
That's a developing story for The Sandbox ecosystem entering August, not a scheduled August catalyst.
Expanding what LAND can do and increasing demand for SAND are two different things.
Are SAND Traders Positioning for a Recovery?
OI-weighted funding sits at -0.0443%, as per the coinglass, negative rather than supportive of a bullish read.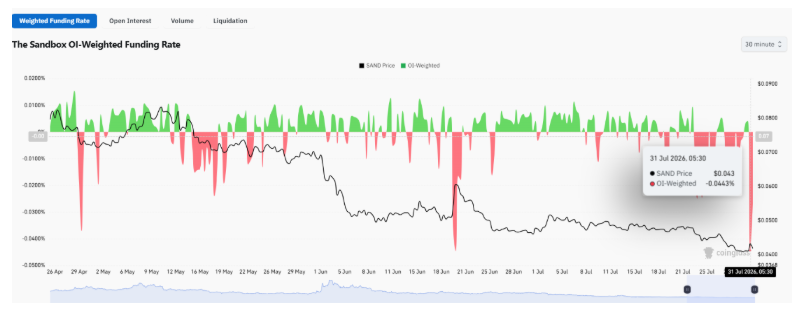 Open interest stands at $16.52M, well below the much higher levels visible earlier in the year; speculative participation remains subdued.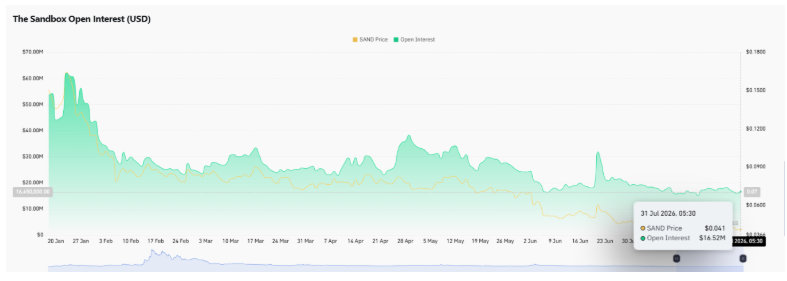
Account positioning tells a different story: Binance's SAND/USDT ratio is 1.2012, OKX's is 1.35, and Binance's top traders run longer still at 1.5988 by account and 1.3212 by position.
All of that leans long, but paired with negative funding and thinner open interest, it reads as mixed rather than confirmed conviction.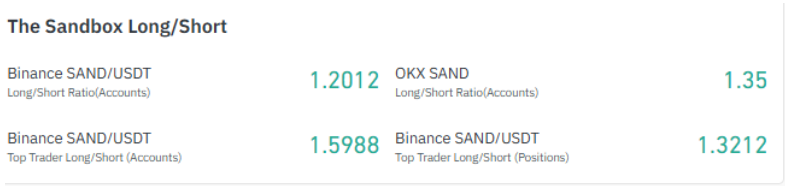
24-hour liquidations totalled $37.79K, split $22.80K long against $14.99K short longs, which took the bigger hit, though the total is too small to call a cascade.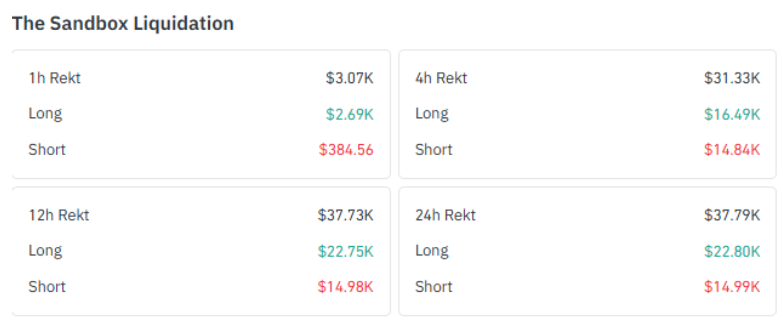
SAND is up 1.95% over 24 hours but remains down 10.05% over 30 days, 41.65% over 90 days, and 61.53% year to date. The latest bounce hasn't repaired the broader decline.
Figures reflect as per the coinglass July 31, 2026.
Can SAND Break Its Daily Downtrend in August?
SAND is trading around $0.041790 on the TradingView daily chart, sitting beneath the descending trendline that has capped the decline for months. 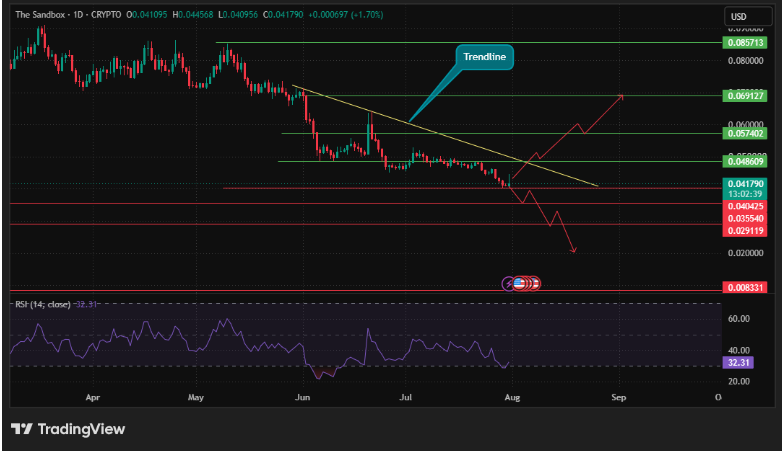
That trendline hasn't broken yet; the paths drawn above and below it on the chart are scenarios, not a record of what's already happened.
Daily RSI reads 32.31, weak and edging toward oversold without technically getting there.
This is where SAND technical analysis carries more weight than the ecosystem headlines for what August does.
$0.048609 is the first important level for August.
Strength through it, following a recovery through the trendline, would improve the setup and open a path toward $0.057402, $0.069127, and $0.085713, the next marked levels, not targets $SAND is expected to reach this month.
$0.040425 is the immediate support and the level that matters most on the downside.
Losing it shifts attention to $0.035540, and below that, $0.029119 is another marked reference. $0.008331 sits much further down the chart and isn't a realistic August scenario.
Is SAND Oversold Enough to Challenge Its Weekly Downtrend?
Zoom out and $SAND trades around $0.041884 inside a large descending channel that has defined its decline. 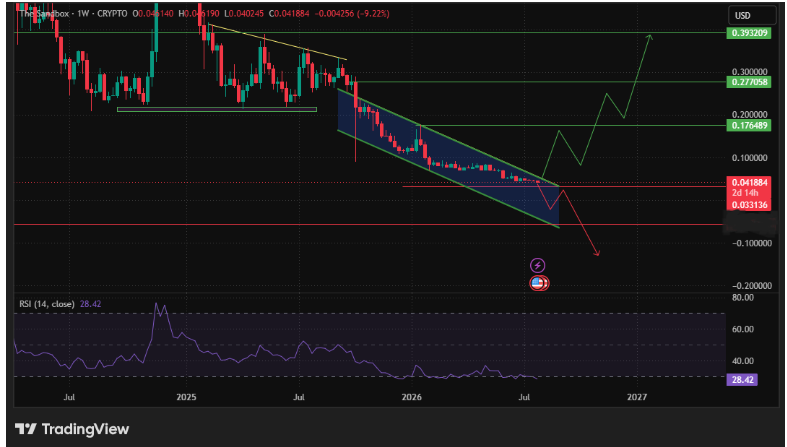
That channel is still intact; the bullish path sketched on the chart is a scenario, not a confirmed move.
Weekly RSI sits at 28.42, below the conventional 30 threshold and technically oversold.
That doesn't mean a reversal is coming; it means momentum has stretched further than usual, which can raise interest in a recovery without guaranteeing one.
$0.033136 is the valid weekly support beneath the current price.
Above the range, $0.176489, $0.277058, and $0.393209 sit as longer-term resistance reference levels belonging to a much bigger move than August is likely to deliver.
The daily chart carries more weight for this month's SAND price outlook since its levels sit closer to the current price.
Between an unresolved daily trendline, an unbroken weekly channel, and weak RSI readings on both timeframes,
SAND heads into August NEUTRAL TO BEARISH, with a genuine but unconfirmed recovery path if price does the work.
The Sandbox Price Prediction August 2026: Bull, Base and Bear Cases
| Scenario | Confirmation / Condition | Levels to Watch | Invalidation / What Weakens the Case |
| Bull | Recovers through the daily trendline, holds above $0.048609 | $0.057402, $0.069127, $0.085713 | Fails to hold $0.048609; weekly channel stays intact |
| Base | Stays in range, no clean break above $0.048609 or below $0.040425 | Range: $0.040425–$0.048609 | A decisive move outside that range |
| Bear | Loses $0.040425 on the daily chart | $0.035540, then $0.029119 | A reclaim of $0.040425 |
Outside this table, the weekly chart adds its own downside marker: a break below $0.033136 would deepen the structural picture beyond what the daily chart shows alone.
What Would Confirm or Weaken SAND's August Setup?
Can SAND finally break its downtrend as The Sandbox develops greater LAND utility?
The update gives the project an ecosystem story entering August, but the studio's public launch is still a Q4 2026 event, not something this month's price needs to react to.
The chart carries more weight here. $0.048609 is the level that would open room to the upside, and $0.040425 is the level that would keep the pressure on if it fails.
Oversold weekly RSI and an improving daily structure leave room for a recovery in this The Sandbox price prediction, but that room only becomes real if price confirms it.
Disclaimer: This analysis is for informational purposes only and does not constitute financial advice. Cryptocurrency markets are volatile, and readers should conduct their own research before making investment decisions.











.jpg)






