Will Ethereum ETF Inflows and Whale Buying Take ETH Towards $3,500?


Ethereum has moved above a key daily resistance level, and traders are now asking one simple question. Can the rally reach $3,500 next?
ETH is trading near $1,933 at the time of writing, up 3.36% on the week. The breakout has put fresh attention on the coin's next resistance zone.
As long as Ethereum holds above this breakout point, the short-term trend favors buyers. But $3,500 is still seen as the first big wall where traders may start taking profits.
What do the charts say about ETH's next move?
Long-term charts show Ethereum forming repeating wedge patterns going back to 2016. Each wedge has come before a strong upward move.
The most recent wedge formed between 2024 and 2026, near the $1,250 to $3,800 range. If the pattern holds true to past cycles, some chart watchers expect a push toward new highs.
Analyst Javon Marks pointed to this repeating structure in a recent post, noting that Ethereum's past cycles have often rhymed with each other, citing prior tops near $5,000, $8,500, and $12,000 as reference points for this cycle.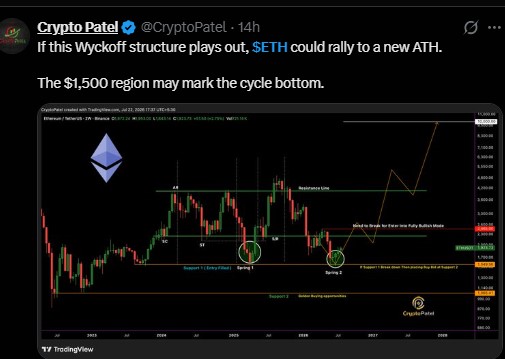
Is Ethereum forming a Wyckoff bottom pattern?
Another popular theory comes from trader Crypto Patel, who shared a Wyckoff-style structure on ETH's weekly chart.
Crypto Patel suggested that if this structure plays out, the altcoin could rally toward a new all-time high, with the $1,500 zone marking the cycle low point.
Wyckoff patterns are used by traders to spot accumulation phases, where big buyers slowly build positions before a larger price move. It's a widely followed method, but it is not a guaranteed signal.
ETH ETF inflows and whale buying add to the picture
Spot Ethereum ETFs saw $72.64 million in net inflows on the same day as the breakout. Steady ETF demand has been one factor supporting ETH price action this year.
At the same time, on-chain data tracked by Lookonchain shows BitMEX co-founder Arthur Hayes has been buying ETH aggressively. Hayes bought another 644.34 ETH, worth about $1.25 million, within the past 8 hours.
Over the past 8 days, Hayes has bought a total of 3,270 ETH, worth roughly $6.27 million, at an average price near $1,917. Large wallet activity like this is often watched closely by traders looking for clues on market sentiment.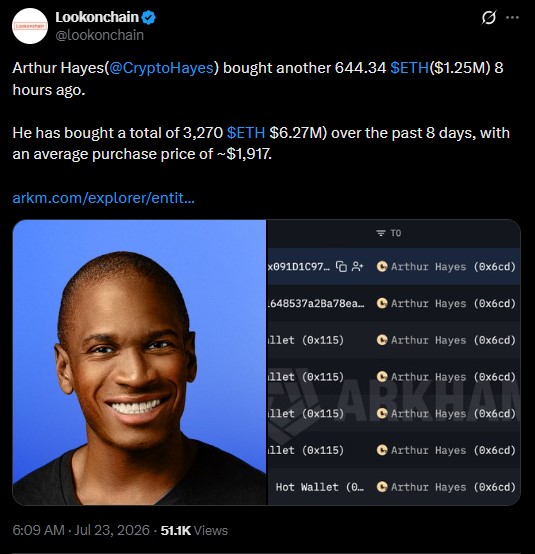
Ethereum price prediction: key levels to watch
Level Type | Price Zone | Significance |
Support (bull case floor) | $1,500 | Possible cycle bottom per Wyckoff view |
Current price | ~$1,933 | Recent breakout zone |
Near-term resistance | $3,500 | First major resistance, possible profit-taking |
Long-term target (bull case) | $5,000–$12,000 | Based on historical wedge pattern repeats |
What could push Ethereum price higher or lower?
Ethereum's next move will likely depend on whether buyers can hold the current breakout level. Continued ETF inflows and steady whale accumulation could support further gains.
On the other hand, failure to clear $3,500 with strong volume could lead to a pullback, especially if broader crypto market sentiment turns weaker.
These patterns and price levels are based on technical analysis shared by traders and should not be treated as certain outcomes.
Disclaimer: This article is for informational purposes only and should not be considered financial or investment advice. Cryptocurrency markets are highly volatile, and prices can rise or fall quickly. Always do your own research and consult a licensed financial advisor before making any investment decisions.
2 months ago
If you’re facing challenges accessing your cryptocurrency or investment funds, I can help. I specialize in crypto recovery and investment retrieval, offering professional support to clients dealing with: Scam or fraudulent platforms Exchanges refusing withdrawals Websites demanding additional deposits before releasing funds Lost access due to platform errors or account issues My goal is to help you recover what’s rightfully yours through safe, legitimate, and structured recovery methods. I review each case carefully, guide you through the proper steps, and help you document and escalate issues to the appropriate channels. If your funds are stuck, withheld, or you’ve been misled by a crypto platform, I’m here to assist you with a clear, professional recovery process. Feel free to reach out to us at privateintrorecovery@ gmail.com WhatsApp or text him at +17742029445


















