Ethereum Price Prediction: Bitmine Stakes $289.4M ETH, What's Next?


Ethereum Price Prediction: ETH Nears $2,000 Resistance, Bitmine Buys
Ethereum is trading close to $1,880 as it pushes into a resistance zone that has stopped rallies before. The move comes right after Bitmine added hundreds of millions of dollars in ETH to its holdings.
Traders are now watching whether the token can finally break through, or whether history repeats itself one more time.
What is Bitmine doing with its ETH holdings?
Bitmine has been busy. Over the past week, the firm staked $289.4 million worth of ETH.
That single move pushed Bitmine's total staked ETH holdings to 4.2% of the entire supply. That is a large chunk for one company to control.
On top of the staking, Bitmine also bought $14.25 million of ETH in the same period. Combined with earlier purchases, the firm now holds 4.8% of all ETH in circulation.
In simple terms, Bitmine is not just holding. It is actively buying and locking up tokens for staking rewards. That reduces the amount available on exchanges, which some traders see as a supply squeeze in the making.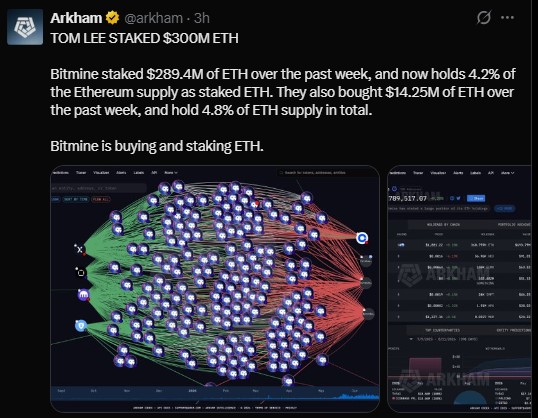
Why does the $1,900-$2,000 zone matter so much right now?
Ethereum's daily chart shows a long-term descending trend. Prices have repeatedly hit a wall near the declining resistance trendline and the 200-day EMA.
Every time that has happened, a sharp drop followed. Past rejections at this same type of resistance have led to declines of roughly 37% to 48%.
Now the price is back at that wall again, this time around $1,900 to $2,000.
Past Rejection Pattern | Result |
Rejection at trendline + 200 EMA | Drop of ~37%-48% |
Current zone | $1,900-$2,000 |
Bearish target if rejected | $1,300-$1,500 |
Bullish invalidation level | Daily close above resistance |
If price fails here again and turns lower, the chart points to a possible drop toward $1,300 to $1,500.
But a strong daily close above this zone, held over time, would break the old pattern. That kind of move could open the door to a bigger trend shift.
Does the Netflix chart comparison actually hold up?
Some analysts have pointed to an old Netflix chart as a loose comparison.
Netflix spent about 40 monthly candles, close to 1,218 days, stuck in a wide trading range before it broke out and climbed to new highs.
ETH has spent around 38 monthly candles, close to 1,159 days, moving inside a similarly wide range.
The two timelines are close, and that has caught the attention of chart watchers. Long consolidation periods can sometimes come before big moves.
That said, a stock and a cryptocurrency are different assets, driven by different forces. The comparison is interesting, but it is not proof the pattern repeats.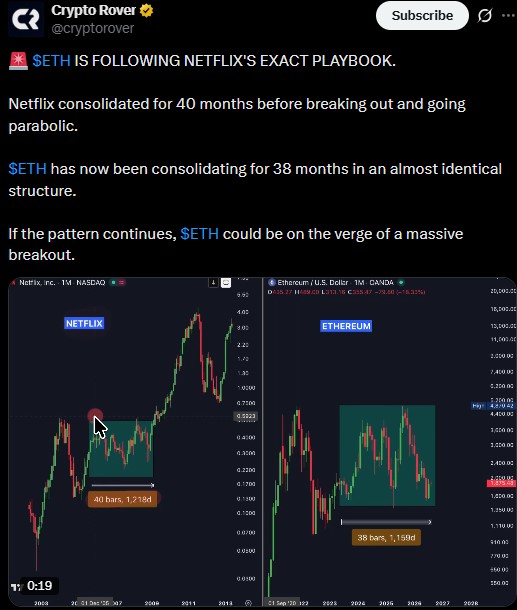
What does the Wyckoff pattern suggest happens next?
Beyond the trendline story, some traders are mapping this chart to a Wyckoff accumulation structure.
Under this theory, price went through a Selling Climax after its big decline, followed by a Secondary Test and a long consolidation stretch.
The chart also shows what looks like a Spring in Phase 2, often described as a shakeout move before prices head higher.
If this structure keeps playing out, the next steps would be a Last Point of Support in Phase 3, then a Sign of Strength and a Breakout/Last Point of Support in Phase 4.
Under this view, resistance sits around $2,500 to $2,630, while major support is placed between $1,585 and $1,705.
A sustained break above that resistance band would support the bullish case. Until that happens, it remains a theory on a chart, not a confirmed move.
Bullish or bearish from here?
Right now, Ethereum sits at a genuine crossroads.
On one side, heavy accumulation from a major holder like Bitmine, plus a possible Wyckoff base, gives bulls something to point to.
On the other side, the long-term downtrend and repeated rejections near this same resistance zone are a real warning sign for anyone ignoring the chart's history.
The next few daily closes near $1,900 to $2,000 will likely decide which story wins out. A clean break and hold above resistance would favor the bulls.
A rejection here, in line with past patterns, keeps the door open for a move back toward $1,300 to $1,500.
No one can say for certain which way this goes. The setup is worth watching either way closely.
Disclaimer
This article is for informational purposes only and does not constitute financial, investment, or trading advice. Cryptocurrency markets are highly volatile and carry significant risk, including the possible loss of your entire investment. Past price patterns do not guarantee future results. Always do your own research and consult a licensed financial advisor before making any investment decisions.
Also read:

















