Pi Network Price Prediction: Could $PI Be the Next Crypto Explosion?


$Pi Network started life as a mobile mining app back in 2019, letting users earn $PI just by tapping in daily, long before mainnet ever launched.
It eventually opened up trading in 2025 and has built out an ecosystem since, including apps, a core team pushing protocol upgrades, and a max supply capped at 100B.
So where does this Pi network price prediction see $PI heading from $0.08815?
$PI Network Live Market Data
$PI is currently trading at $0.08815, up 1.2% over 24 hours, ranging between $0.08493 and $0.08882 in that window. 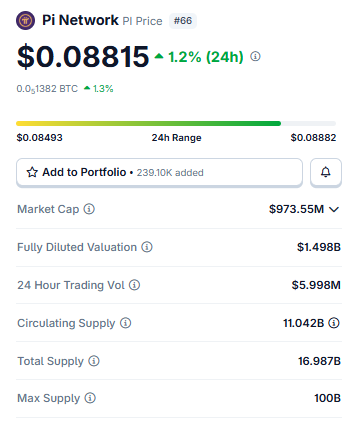
Source: $PI market cap data taken from Coingecko, data as of Aug 12, 2026. Figures may vary slightly across other tracking websites.
Market cap comes in at $973.55M against a $1.498B FDV, with circulating supply at 11.042B out of a 16.987B total and a 100B max supply cap. 24h volume: $5.998M.
$PI Network New Today
Pi Network's Core Team rolled out Protocol v26 recently, described as one of the last upgrades before Protocol 27, which is expected to wrap up the network's current development period sometime in the second half of 2026. 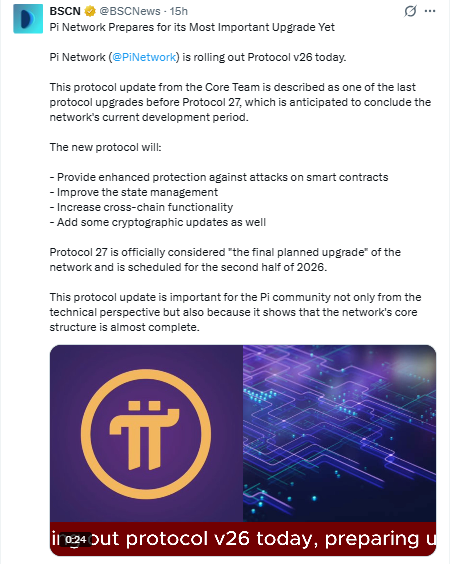
Source: Data Taken From @BSCNews , X Account.
The update adds stronger protection against smart contract attacks, better state management, more cross-chain functionality, and some cryptographic changes.
Whether that translates into near-term price action is unclear, but it signals the network's core structure is close to finished, which some in the community see as a longer-term positive.
Key Takeaways
-
$PI's trading near $0.08846, up 1.2% on the day, still holding inside its recent range.
-
1H chart shows price stuck in an ascending triangle. The breakout call here matters short-term.
-
On the 4H, a rising trendline keeps getting tested. Hold it and momentum builds; lose it and things get shaky.
-
This pi network price prediction covers both setups below.
Technical Analysis for $PI Network
Hourly Chart Analysis for Pi Network Price Prediction
In the hourly chart, the $PI price is boxed inside an ascending triangle, trading near $0.08846 against flat resistance around $0.08900. 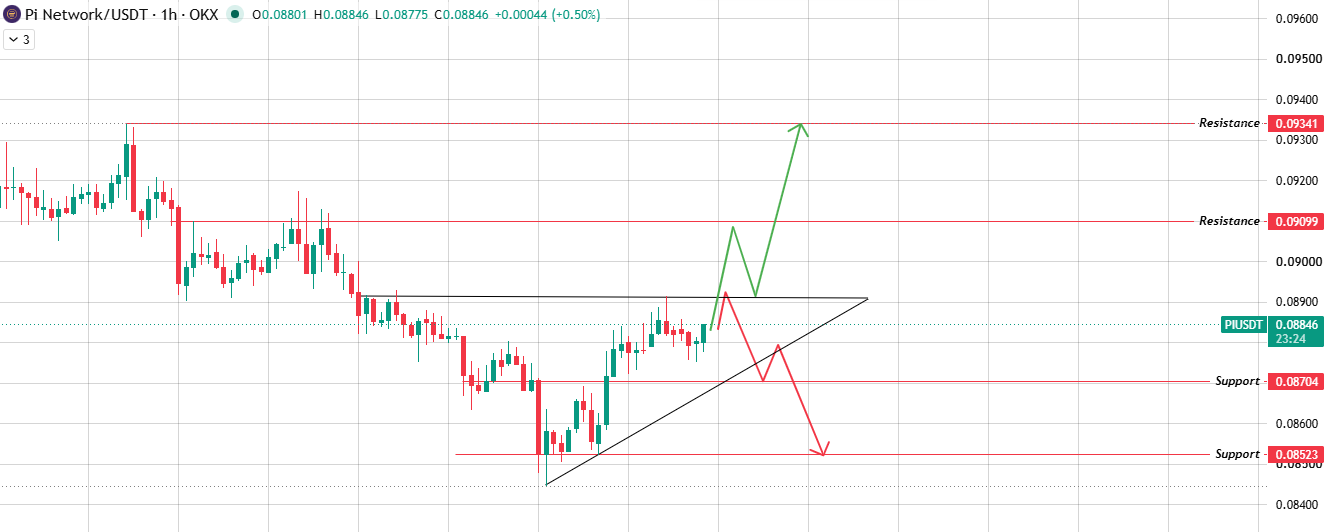
Source: Chart Taken From TradingView .
Break that upper triangle resistance boundary with volume; $0.09099 comes into view, then $0.09341.
Get rejected instead, and the price likely slides back to test the triangle's rising trendline.
Break that too, and $0.08704 then $0.08523 open up next.
This pi network price prediction treats that triangle breakout as the trigger worth watching.
4-Hour Chart Analysis for Pi Network Price Prediction
Bigger picture, the $PI's been respecting a rising trendline for a while now, and the price is currently trading at $0.08759.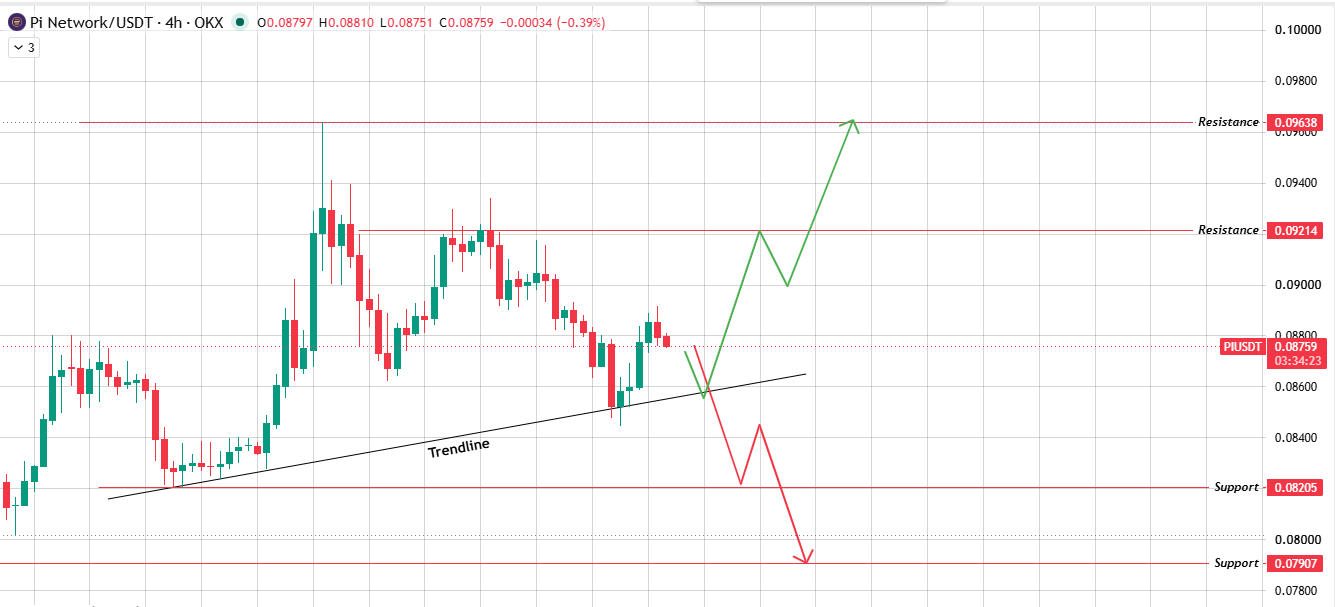
Source: Chart Taken From TradingView.
Bounce off it with volume, and $0.09214 opens up, then $0.09638.
Break the trendline instead, and support drops to $0.08205, with $0.07907 below that. This level is the one to watch on the higher timeframe.
Pi Network Price Prediction: Bull, Base, and Bear Case
Technically derived scenarios, not guarantees. Markets move.
Glossary
Ascending Triangle: Flat resistance up top, rising support below, usually resolves with a breakout.
Rising Trendline: A line of higher lows acting as support until the price breaks under it.
Support and Resistance: The floor and ceiling price bounces off until it doesn't.
Fully Diluted Valuation (FDV): What max supply would be worth if every token existed today?
Max Supply: The hard cap on how many tokens will ever exist, 100B in PI's case.
Methodology
Chart levels in this pi network price prediction come straight off $PI/USDT on OKX via TradingView, 1H and 4H. Market data reflects values at the time of writing. Nothing here is extrapolated beyond what the charts actually show.
Disclaimer: This Pi network price prediction is informational only, not financial advice. Crypto is volatile, PI included, and price can move against any scenario above. Do your own research; talk to a licensed advisor before acting on this.

















