Ethereum Price Prediction: ETH Struggles to Hold $1,850 Support Level


Ethereum is going through a rough patch. After a strong run in July, the coin has slipped back below a key trendline, and traders are trying to figure out what comes next.
ETH is trading near $1,870 at the time of writing, down from highs above $2,000 just days ago. The pullback has traders split between calling it a healthy reset or the start of something worse.
What is Ethereum's price doing right now?
Ethereum broke below its rising channel on the daily chart. That channel had guided the price higher since late June.
The break also pushed the altcoin under its 50-day EMA, which sits near $1,850. Losing that level usually signals that short-term momentum has flipped.
The RSI is hovering close to neutral around 51, not oversold. That means there could still be room for the price to fall further before buyers step back in.
Did the TD Sequential really call this move?
A widely shared chart from Ali Charts points out that the TD Sequential indicator flashed a buy signal near $1,500 in July. Ethereum then rallied more than 31% from that point.
Now, with ETH trading closer to $1,900 to $1,980 depending on the exchange, the same indicator has flipped to a sell signal. That doesn't guarantee a drop, but it does suggest momentum traders may start locking in gains.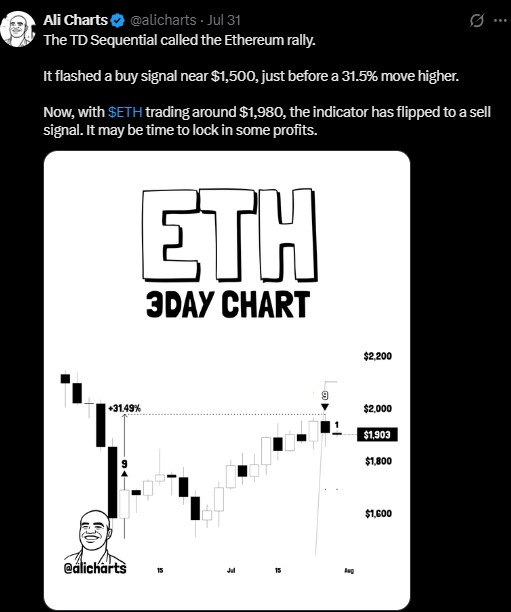
Key support and resistance levels to watch
Level Type | Price | Notes |
Resistance | $1,930 | Former channel support, now resistance |
Resistance | $2,000 | Psychological level |
Resistance | $2,100 | Next upside target if reclaimed |
Support | $1,850 | 50-day EMA |
Support | $1,750 | First downside target |
Support | $1,650 | Stronger demand zone |
If ETH stays below $1,930, the path of least resistance points toward $1,750, and possibly $1,650 if selling picks up.
A daily close back above $1,930 would change the picture. That could open the door for another push toward $2,000 and $2,100.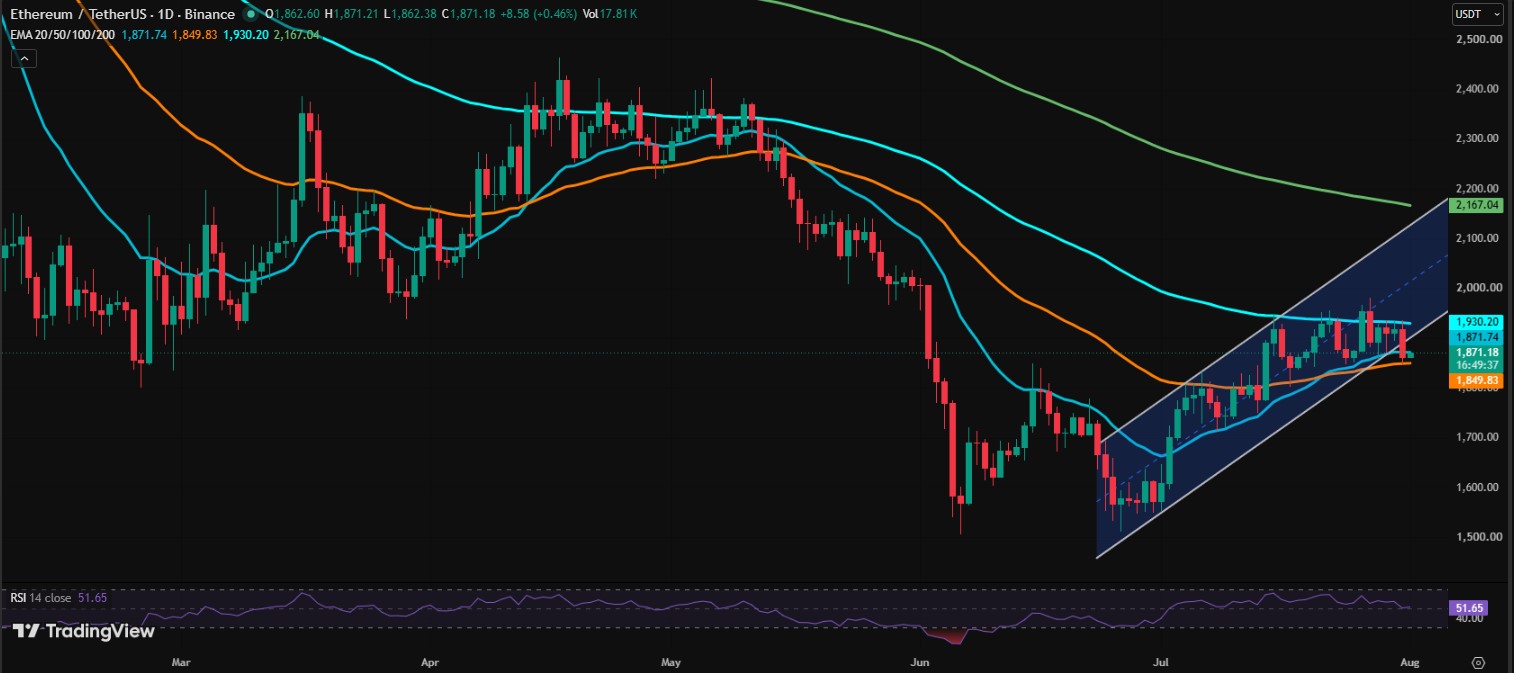
Are whales still buying Ethereum?
Despite the price dip, large holders don't seem worried. Tom Lee's Bitmine reportedly picked up another 10,464 ETH worth close to $19.48 million from a wallet linked to FalconX.
Separately, another large wallet added 7,919.5 ETH worth about $14.89 million in a single day. Since late June, that same wallet has accumulated over 74,000 ETH at an average price near $1,771.
What does the derivatives data show?
Open interest on Ethereum futures rose 1.80% to $26.63 billion even as trading volume dropped 9.14%. That combination usually means traders are opening new positions rather than closing old ones.
Long-to-short ratios on Binance and OKX both sit above 2.0, showing more traders are leaning bullish.
Liquidation data backs this up too. Over the past 24 hours, $46.31 million in long positions were wiped out compared to just $5.22 million in shorts.
That pattern suggests the recent dip mostly flushed out over-leveraged bulls rather than sparking a broader bearish shift.
Ethereum Price Prediction: The bottom line for ETH right now
Ethereum sits at a crossroads. The channel breakdown and lost EMA support point to near-term weakness. But whale accumulation and bullish derivatives positioning tell a different story underneath the surface.
A lot may come down to whether ETH can climb back above $1,930 in the next few sessions. Until then, traders should watch the $1,750 and $1,650 zones for signs of where buyers might step back in.
Disclaimer
This article is for informational purposes only and does not constitute financial, investment, or trading advice. Cryptocurrency markets are highly volatile and carry significant risk. Always do your own research and consult a licensed financial advisor before making any investment decisions.















.jpg)




