Venom Price Prediction 2026: Can $VENOM Hit $0.05?


A token that was sitting at its lowest point ever just days ago is suddenly the loudest name on the board, and the chart alone does not explain why. Something else changed behind the scenes this week, quietly, then all at once. Is this a dead cat bounce or the start of a real recovery leg? This Venom price prediction walks through the daily chart, the weekly structure, and the network data behind the move, plus the bridge incident report that dropped right before it.
Table of Contents
Why $VENOM Is Moving Today
$VENOM Technical Analysis: Daily Chart
$VENOM Technical Analysis: Weekly Chart
$VENOM Support And Resistance Levels
$VENOM Price Prediction: Scenarios By Timeframe
Tokenomics And Network Data
$VENOM Altcoin Market Position
$VENOM Market Outlook: Risks To Watch
Key Takeaways
$VENOM trades near $0.01584, up 64.33% in the past 24 hours per CoinMarketCap.
The token is up over 104% from its all-time low of $0.007733, set just four days ago.
Daily RSI sits near 69.54, approaching overbought; weekly RSI reads 34.94, still recovering.
Invalidation for the bullish case sits under $0.0109 on the daily chart.
Why $VENOM Is Moving Today
This Venom price prediction matters because VENOM trades near $0.01584 after a 24-hour move of more than 64%, per CoinMarketCap. Here's the thing: this bounce started from an all-time low of $0.007733, hit only four days ago.
Volume backs it up. 24-hour trading volume jumped over 550% to $1.21M, pushing the volume to market cap ratio to 7.7%.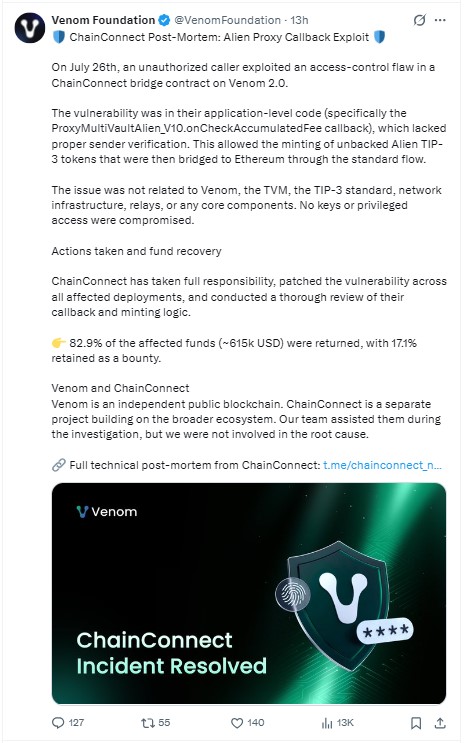
Turns out, sentiment had another lever too. The Venom Foundation published a ChainConnect bridge exploit post-mortem, confirming 82.9% of the roughly $615K affected funds got returned. Fast turnaround. That kind of accountability tends to calm nerves fast.
None of this happened off a single catalyst. And a token bouncing this hard off an all-time low always draws attention, fair or not.
Anyone tracking where VENOM actually trades should check a current exchange listing page for active pairs.
$VENOM Technical Analysis: Daily Chart
On the daily chart, VENOM is quoted near $0.01536, breaking out of a multi-month descending channel after weeks of lower highs. Resistance stacks at $0.02866, then $0.04294. Support sits at $0.01086, then $0.00765.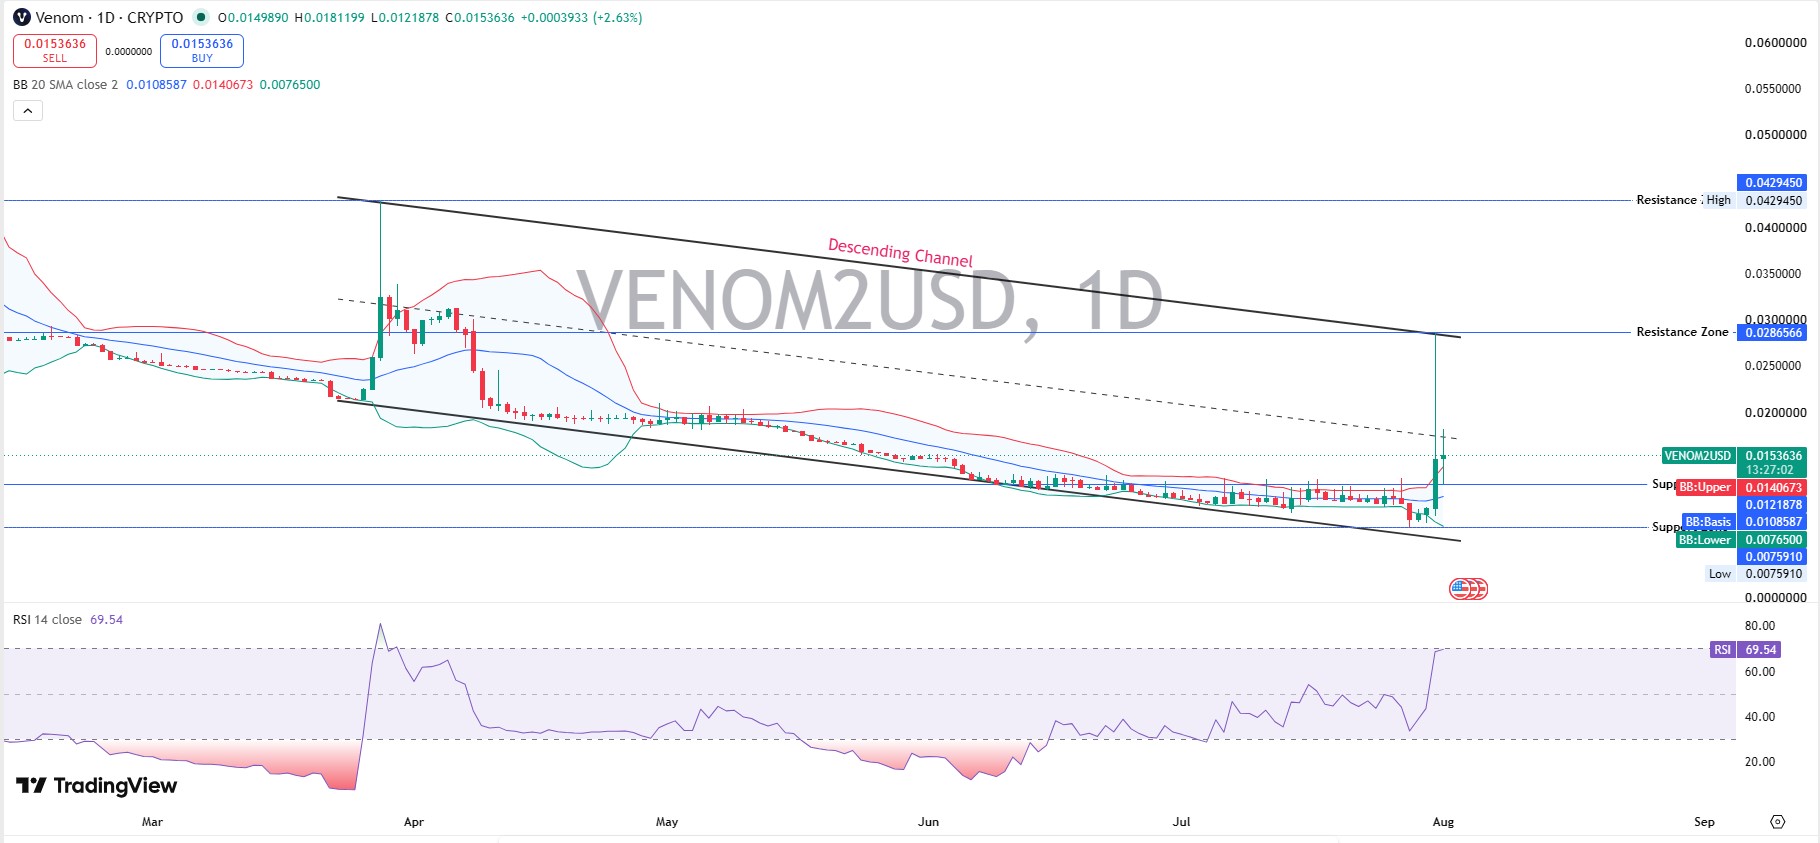
Daily RSI reads 69.54, closing in on overbought. When we pulled up the TradingView chart, what stood out was how fast this candle cleared the channel ceiling, not just that it did.
A pullback holding above $0.0109 keeps this constructive. Losing it fast would put the whole breakout in question.
Broader risk appetite matters here too, since thin-cap tokens like VENOM tend to track the wider bitcoin price outlook more than people admit.
$VENOM Technical Analysis: Weekly Chart
Zoom out, and $VENOM trading near $0.01607, up over 49% from last week's open, forming what looks like a rounded bottom against a multi-year downtrend. Weekly resistance sits far out at $0.13163, then $0.24637, then $0.44882.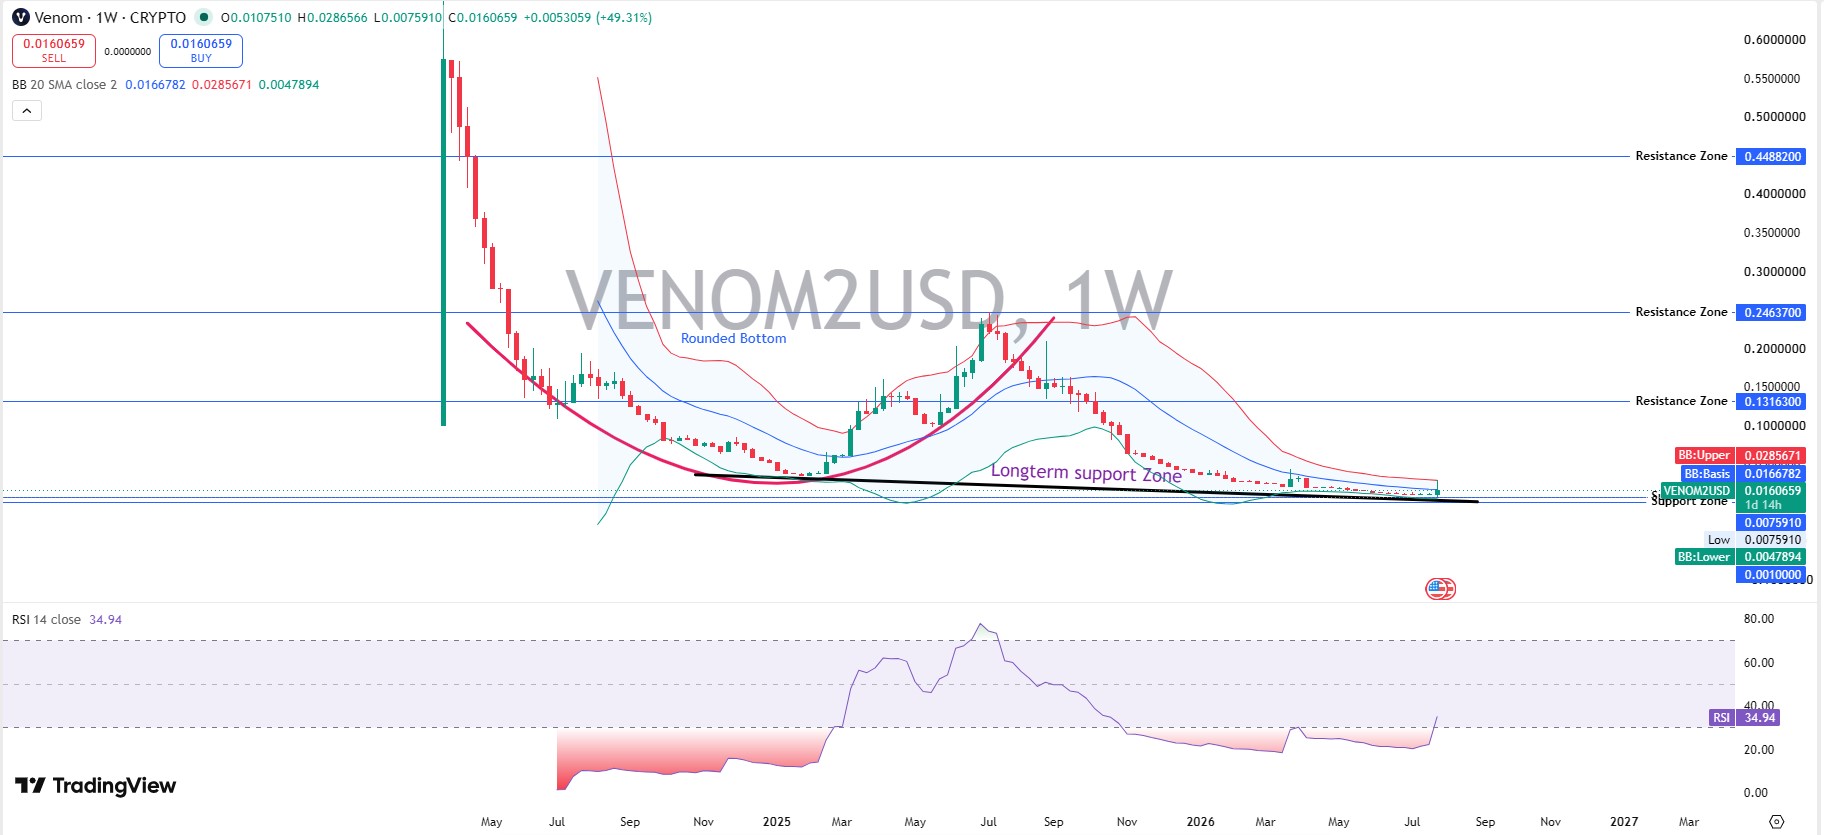
Weekly RSI reads 34.94, still below neutral. Basically, one strong weekly candle off a record low is not full confirmation on its own.
A close below $0.0109 would break the recovery structure on both timeframes at once. That's the level to watch.
VENOM is forming a potential rounded-bottom structure on the weekly chart, with price consolidating near long-term support. A breakout above the neckline and resistance could confirm a bullish reversal, but it still needs volume behind it.
$VENOM Support And Resistance Levels
Immediate support: $0.01086, then $0.00765, near the recent all-time low. Immediate resistance: $0.02866, then $0.04294. A daily close above $0.02866 would confirm the channel break with more conviction.
Layer 1 tokens often recover from a low before trending, and the same pattern showed up in the recent altcoin price rally coverage, just off a different setup.
$VENOM Price Prediction: Scenarios By Timeframe
Timeframe | Bull Case | Base Case | Bear Case |
24H | Holds above $0.0154, tests $0.0287 (moderate) | Chops between $0.012-$0.018 (high) | Slips under $0.0109 toward $0.0077 (low) |
7D | A weekly close above $0.0287 opens $0.0429 (low-moderate) | Range-bound inside the new channel (high) | A weekly close under $0.0109 retests the low (moderate) |
2026 | A rounded bottom resolves toward $0.1316-$0.2464 (low-moderate) | Drifts $0.01-$0.03 tracking network data (moderate) | Breaks $0.0077, sets a fresh low (low) |
Invalidation for the bullish case is a daily close under $0.0109.
Tokenomics And Network Data
The circulating supply sits near 988.91M VENOM against a max supply of 8B, giving a market cap of $15.67M and an FDV near $126.78M, a wide gap worth noting.
Per the project whitepaper, the mainnet's initial 7.2B token supply had only 25.5% unlocked at launch, with 74.5% under lock across community, ecosystem, foundation, and team allocations vesting over 36 to 90 months.
Public and market liquidity tranches unlocked in full at TGE, roughly 756M tokens combined. That locked majority is the real overhang behind any Venom price prediction right now.
On venomscan, the network shows over 266.6M total transactions and 10.8M accounts across 45 active validators, real usage, not just a price chart.
$VENOM Altcoin Market Position
VENOM sits in the Layer 1 blockchain corner of the altcoin market, competing on throughput and validator decentralization rather than hype cycles alone. CertiK rates the project 3.3 out of 5, a middling score that leaves room for improvement.
And unlike single-purpose tokens, VENOM's value depends on chain adoption, not just speculation. That link to actual usage cuts both ways.
A broader read on where ethereum price action sits this cycle offers context, since Layer 1 tokens often move as a group when capital rotates.
Rate decisions matter too. A softer Fed rate decision tends to lift risk appetite across smaller-cap Layer 1 names, VENOM included.
$VENOM Market Outlook: Risks To Watch
The locked 74.5% of supply is the biggest overhang, and vesting unlocks over the next few years could cap upside if demand does not keep pace.
Fine. The bridge incident got resolved with funds mostly returned, but bridge risk on any chain never fully disappears.
Bounces off an all-time low can fail. Was this really different or just short covering? Hard to say yet.
Regulatory headlines shift sentiment fast across the board, and the ongoing Clarity Act developments are one to track.
Staying current on broader crypto news tends to flag these shifts before prices do.
Anyone tracking follow-through catalysts can check upcoming dates on a coin events calendar, since unlocks often line up with volatility like this.
Methodology: Chart levels came from VENOM/USD daily and weekly charts on TradingView, using RSI-14 and 20-period Bollinger Bands, captured on August 1, 2026, around 11:00 UTC. Price, supply, and market cap data came from CoinMarketCap, also captured August 1, 2026, near 11:00 UTC. Tokenomics figures came from the Venom Foundation whitepaper. Network and validator data came from venomscan.com. Bridge incident details came from the Venom Foundation's public statement on X.
Disclaimer: This is speculative market commentary, not financial or investment advice. Crypto assets are volatile and can lose most or all of their value. Verify live figures before trading.













.jpg)




