Ethereum Price Prediction: ETH Eyes $2,300 as Exchange Supply Drops


What Is the Ethereum Price Today
The Ethereum price is trading around $1,919, down about 1% on the day. Ether has pulled back from recent highs, but traders are watching closely for a bigger move.
Futures volume dropped nearly 20% in the last 24 hours to $31.61 billion. Open interest also slipped slightly to $27.68 billion. Despite the dip, options activity is climbing, with options open interest up 5.63% to $5.05 billion.
This mixed data suggests traders are still active in ETH markets, even as short-term momentum cools off.
Why Is Ethereum Price Going Up Today
Ethereum has grabbed attention this week for a simple reason. Coins are leaving exchanges fast.
According to data shared by analyst Ali Charts, nearly 1 million ETH, worth close to $2 billion, has been pulled off exchanges over the past month. Exchange balances have fallen from around 17.2 million ETH to near 16.4 million ETH.
Falling exchange supply usually means fewer coins are ready to be sold. Traders often read this as a sign that holders expect prices to rise later.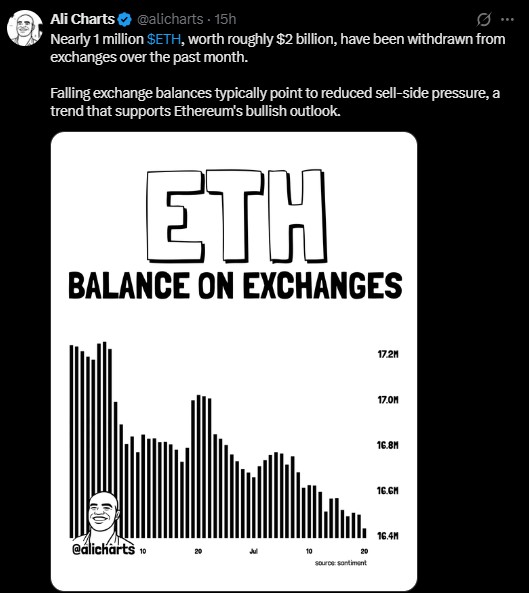
Will $ETH Price Hold Above $1,850
Ali Charts also pointed to a possible double bottom pattern forming on Ethereum's chart. In this setup, $1,850 becomes the key level that needs to hold.
If the altcoin stays above that zone, the next target on the upside sits near $2,300, based on this pattern.
Double bottoms are a common chart pattern that can signal a shift from selling pressure to buying interest. But nothing is guaranteed, and Ethereum will need strong buying volume to confirm this setup.
Are Ethereum ETFs Seeing Inflows or Outflows
Institutional demand for Ether isn't fading either. US spot Ether ETFs recorded a third straight day of net inflows on July 21, pulling in a combined $37.47 million, according to SoSoValue data.
BlackRock's ETHA fund led the pack with $52.79 million in fresh inflows. Fidelity's FETH saw the opposite, losing $15.32 million to outflows. Other ETH ETF products reported flat flows for the day.
Steady ETF inflows, even modest ones, show that some institutional money continues to enter the Ethereum market despite recent price swings.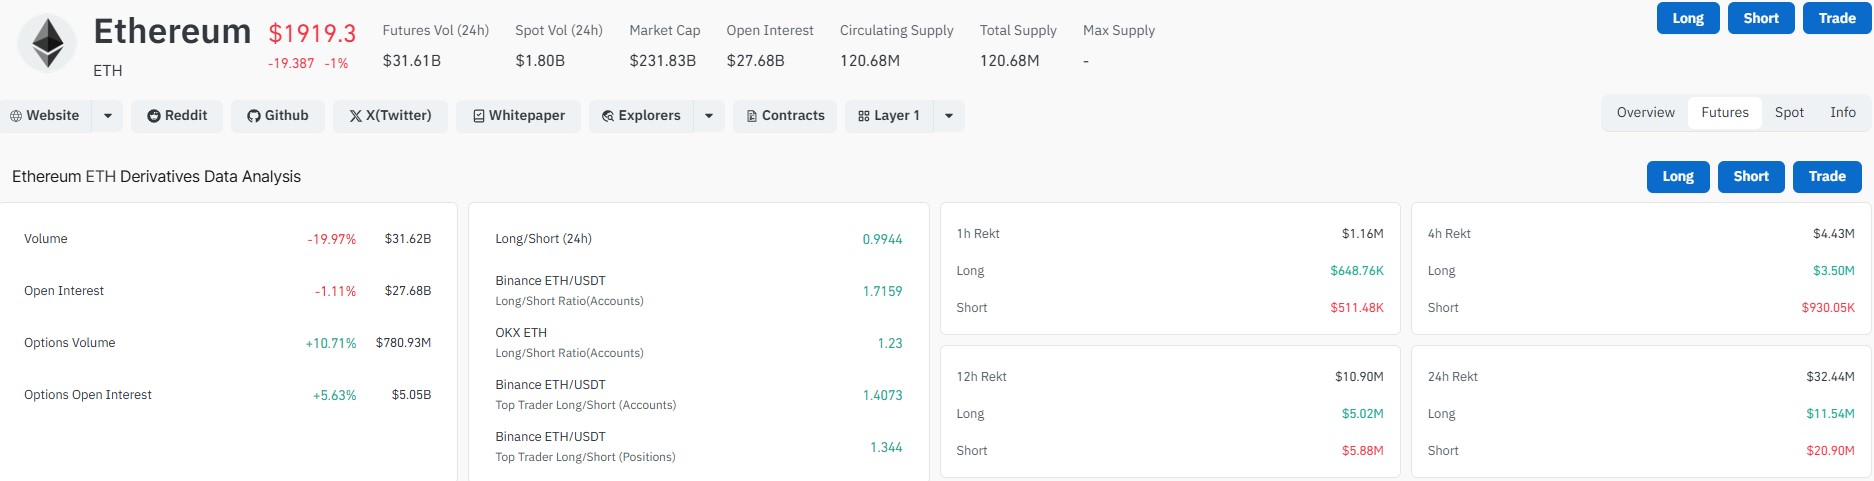
Ethereum Price Prediction: What the Charts Show
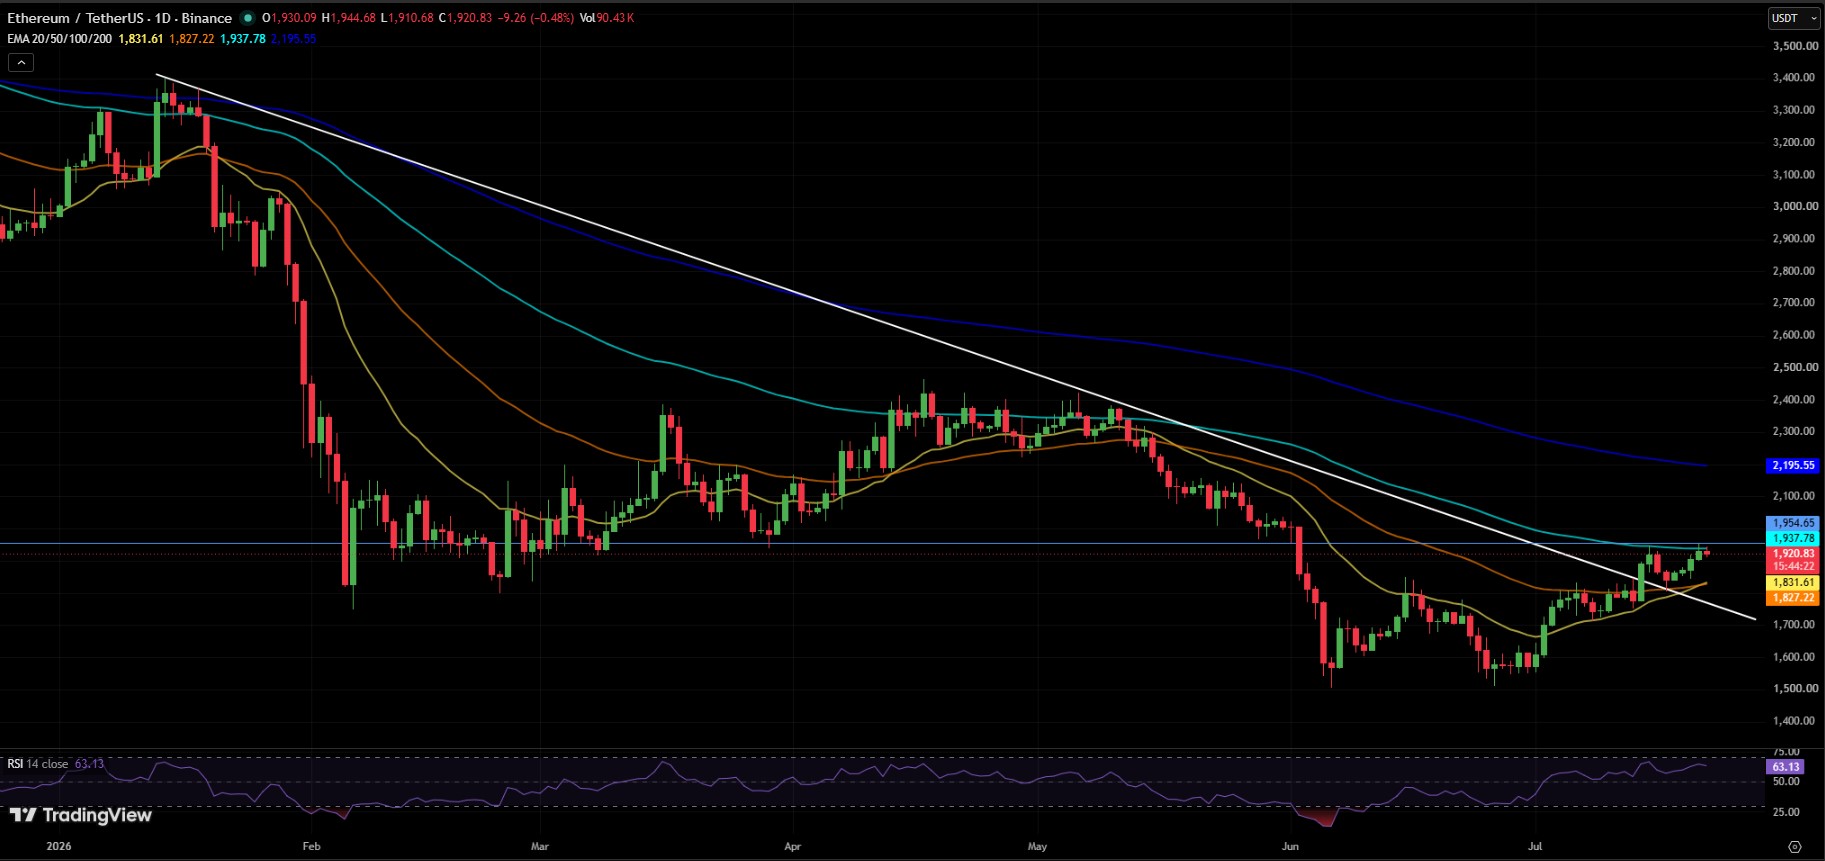
Looking at the daily chart, $ETH is trying to recover after bouncing off a recent low near $1,500.
The altcoin is now trading above both its 20-day and 50-day exponential moving averages. That's a short-term bullish sign.
However, price is testing resistance at the 100-day EMA near $1,938, along with a longer descending trendline.
The Relative Strength Index (RSI) sits around 63. That points to growing bullish momentum, but ETH isn't in overbought territory yet.
Key Levels to Watch
Level Type | Price Zone | What It Means |
Resistance | $1,950 - $2,000 | Break above could open room to $2,100-$2,200 |
Current Price | ~$1,920 | Testing 100-day EMA at $1,938 |
Support | $1,800 - $1,850 | Pullback zone if resistance holds |
Upside Target | $2,300 | Based on double bottom pattern, if $1,850 holds |
Where Is Ethereum Price Headed Next
If buyers manage to push it above the $1,950 to $2,000 zone and hold it, it could extend gains toward $2,100 to $2,200 in the coming weeks.
On the other hand, if this resistance holds firm, the altcoin may slip back toward the $1,800 to $1,850 support area before trying again.
Is Ethereum a Good Buy Right Now
Overall, Ethereum's chart shows cautious bullish momentum for now. Falling exchange balances and steady ETF inflows add some support to the bullish case.
But a real trend reversal still needs a clear breakout above the long-term descending trendline and the 100-day EMA. Until that happens, ETH remains in a wait-and-see zone for many traders.
Disclaimer
This article is for informational purposes only and does not constitute financial, investment, or trading advice. Cryptocurrency markets are highly volatile and unpredictable. Always do your own research and consult a licensed financial advisor before making any investment decisions. Past performance does not guarantee future results.
Also read:
















