ETHGas Price Prediction: $GWEI Explodes 37% in a Day, Is $0.04 Next?

GWEI Price Status Today
$GWEI is trading at $0.02524 on August 7, 2026, up 6.63% on the 4-hour candle after breaking out of a rising channel with a bullish 20 and 50 EMA crossover forming.
This ETHGas price prediction looks at whether the token can extend toward $0.04004 or whether an overbought RSI reading points to a pullback first.
Key Takeaways
-
The token has broken out of a rising channel on the 4-hour chart, with the 20 and 50 EMA forming an early bullish crossover.
-
Market cap is up 37.02% to $42.68 million, while 24-hour volume has jumped 370.64% to $34.7 million.
-
RSI sits at 86.66, deep in overbought territory, so a pullback toward $0.01988 would not be unusual even inside an uptrend.
-
If the rally continues, resistance levels to watch are $0.02841, then $0.03071, then $0.04004.
-
If the price reverses, $0.01988 is the first support, followed by the EMA cluster, then $0.01478.
-
The broader structure is still a recovery from a June 29, 2026, high of $0.252 and a deeper low near $0.01478 on July 25.
ETHGas Price Prediction: Current Market Overview
At the time of writing, $GWEI trades at $0.02524, according to CoinMarketCap data checked on August 7, 2026, at 16:26 IST.
Market cap stands at $42.68 million, up 37.02%, while 24-hour trading volume has surged 370.64% to $34.7 million, pushing the volume to market cap ratio to 81.31%.
Fully diluted valuation (FDV) sits at $243.88 million, with liquidity to market cap at 3.54%.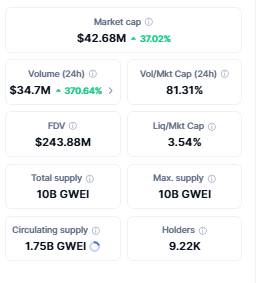
Total supply and max supply are both fixed at 10 billion tokens, with circulating supply at 1.75 billion, roughly 17.5% of total supply. Holder count stands at 9,220 wallets.
This ETHGas price prediction focuses on whether today's breakout can hold given how overbought the token now looks.
ETHGas Technical Analysis: Channel Breakout and EMA Crossover
The 4-hour GWEI/USDT perpetual chart on TradingView has been shaped by a long downtrend that started well before the visible chart window.
On June 29, 2026, the price printed a high of $0.252, after which it reversed sharply lower.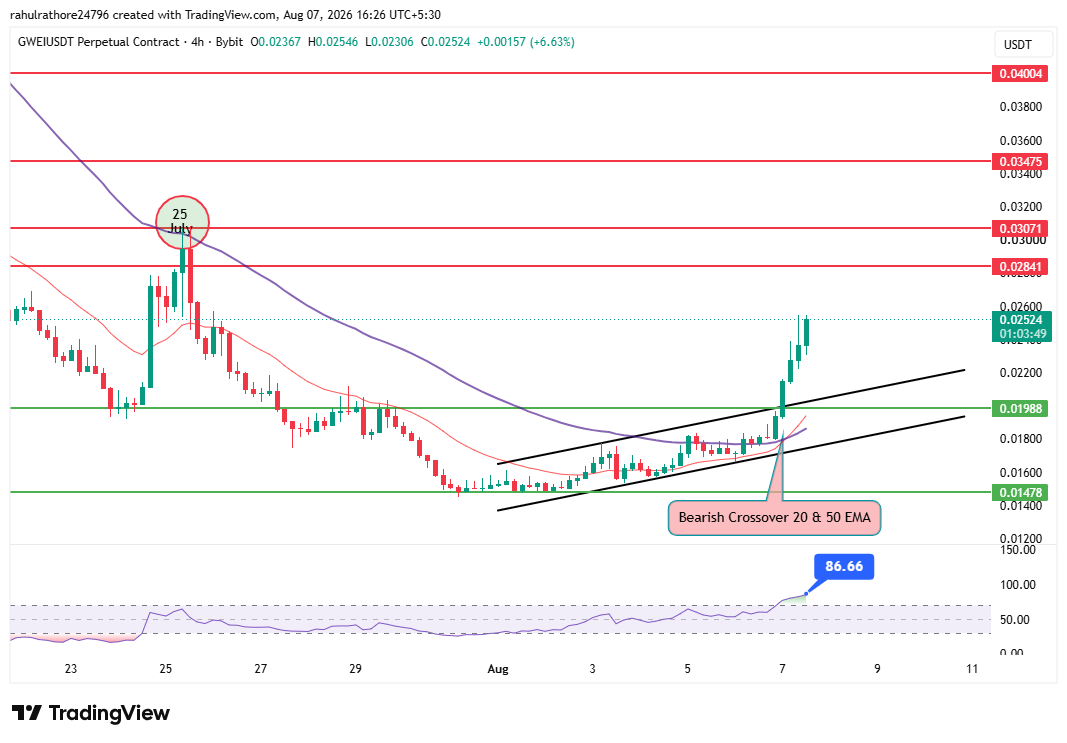
On July 7, 2026, the 20 and 50 EMA formed a bearish crossover, confirming that downtrend. Price continued falling to the $0.01988 level.
Price attempted to reclaim the EMA on July 25, 2026, but that attempt failed, and it printed a new lower low near $0.01478. From there, the token moved into a rising channel, gradually climbing inside two upward-sloping trendlines.
On August 7, 2026, price broke out of this rising channel, and the EMA cluster has now formed a bullish crossover. RSI has pushed to 86.66, deep inside overbought territory above 70, so a pullback is not unusual even if the broader trend stays constructive.
Source: TradingView, GWEIUSDT 4-hour chart, checked August 7, 2026, 16:26 IST.
Methodology
The price levels in this ETHGas price prediction are drawn from the 4-hour chart on TradingView, using prior swing highs, swing lows, and the current EMA structure.
Market data, including market cap, volume, and supply figures, is sourced from CoinMarketCap.
Long/short and liquidation data is sourced from Coinglass futures data. All figures were checked on August 7, 2026, and can shift quickly given how thin the token's liquidity to market cap ratio is.
ETHGas Price Prediction: Bear, Base, and Bull Case Scenarios
| Scenario | Price Target | Key Assumption | Invalidation Condition |
| Bull Case | $0.02841 to $0.04004 | Channel breakout holds , EMA crossover confirms, volume stays elevated | A 4-hour close back below $0.01988 would invalidate the bullish structure |
| Base Case | $0.01988 to $0.02841 | RSI cools from overbought without a full trend reversal | A break outside this range in either direction would invalidate the range-bound view |
| Bear Case | $0.01988 down to $0.01478 | Overbought RSI triggers a sharp pullback, EMA crossover fails | A close back above $0.02841 would invalidate the bearish case |
In the bull case, sustained volume above today's surge could carry price through $0.02841 toward $0.03071 and eventually $0.04004.
In the bear case, a pullback from the current overbought reading could send price back to the $0.01988 support first, with the EMA cluster and the $0.01478 low as deeper levels if selling picks up.
Futures Positioning and Liquidation Data
Liquidations on futures totaled $284.00K over the past 24 hours, with longs taking the bigger hit at $179.21K against $104.78K on the short side.
Over the last 12 hours, liquidations reached $261.01K, again skewed toward longs at $167.01K.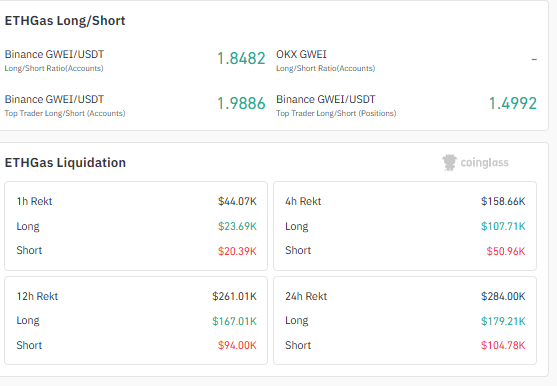
This suggests the move higher has not been a clean one-way squeeze, with leveraged positions on both sides getting caught out during the volatility.
Trader positioning still leans long. On Binance, the long to short ratio by accounts stands at 1.85, and top traders are positioned even more long at 1.99 by accounts, though top trader positioning by size is more moderate at 1.50.
Source: Coinglass, liquidation data, checked August 7, 2026.
Expert Opinion
According to CoinGabbar analysis, this ETHGas price prediction sits at an unusual point where the technical picture and the momentum picture are pulling in different directions.
The channel breakout and EMA crossover both support further upside, but an RSI reading above 85 rarely holds without at least a partial cooldown.
The scale of today's volume increase, up more than 370%, shows this is not a low-conviction move, yet the heavy long-side liquidations over the past 24 hours are a reminder that leveraged positioning is already stretched.
A pullback toward $0.01988 would not break the bullish structure built since the July 25 low.
This ETHGas price prediction is an independent analysis. CoinGabbar has no sponsorship, affiliate, or promotional relationship with ETHGas or the GWEI token.
Glossary
Exponential Moving Average (EMA): A trend indicator that weights recent price action more heavily than older data, often used to spot crossovers and trend shifts.
Relative Strength Index (RSI): A momentum gauge scaled from 0 to 100 that flags overbought conditions above 70 and oversold conditions below 30.
Rising Channel: A chart pattern formed by two upward sloping, parallel trendlines, where price moves higher in a controlled range until it breaks out or breaks down.
Fully Diluted Valuation (FDV): The theoretical market cap of a token if its entire max supply were in circulation at the current price.
Long/Short Ratio: A measure of how many futures traders are betting on price going up versus down, used as a gauge of market sentiment.
Disclaimer: This article is for informational purposes only and should not be considered financial advice. Cryptocurrency prices are highly volatile and can be influenced by market sentiment, liquidity, and broader macro conditions. Readers should conduct their own research and consult a qualified financial advisor before making investment decisions. Past performance and technical patterns do not guarantee future results.
















