ETHGas Price Prediction: GWEI Falls 63% in 7 Days. What's Next?

GWEI just lost more than 60% of its value in a single week, and the sell-off has pulled it 78.75% below its all-time high of $0.2444.
ETHGas is a protocol that turns Ethereum blockspace into a tradeable market, and the GWEI token governs that system through staking and voting.
This kind of drawdown naturally sends people searching for an ETHGas price prediction to figure out if the worst is over.
Right now the charts and the on-chain data both point to sellers still being in control, with liquidations piling up and volume drying up across major exchanges.
ETHGas Price Prediction: Market Overview
Metric | Value |
24h Change | Down -15% |
Market Cap | $107.5M |
FDV | $512M |
24h Volume | $6.9M (down 44-70% day over day) |
Circulating Supply | 2.1B $GWEI |
Total / Max Supply | 10B $GWEI |
All Time High | $0.2444 (-78.75% from here) |
All Time Low | $0.01668 (+211% from here) |
Source: Data from CoinGecko
ETHGas Coin News: Why Is ETHGas Crypto Crashing?
The main driver here is not a hack or a cover-up. It comes down to Ethereum itself.
Gas fees on the Ethereum network have dropped to some of the lowest levels this cycle, sitting in a fraction of a Gwei range on most days recently.
Since GWEI's whole value story is built around Ethereum blockspace and gas demand, a quiet network directly weakens the token's utility narrative, according to a recent AMBCrypto report that linked an earlier GWEI decline to the same falling gas fee trend.
Add to that a broader slowdown in altcoin demand this week, and GWEI has nowhere to hide.
Its low circulating supply of just 21% also plays a role. With fewer tokens actively trading, even moderate sell pressure moves the price more sharply than it would in a deeper market.
This combination, quiet network activity plus thin liquidity plus a weak altcoin mood, is what has turned a correction into a steep slide.
ETHGas Liquidation Data and Volume Heatmap
The last 24 hours saw $127.96K in total liquidations, and longs took the bulk of the damage at $100.95K against just $27K on the short side.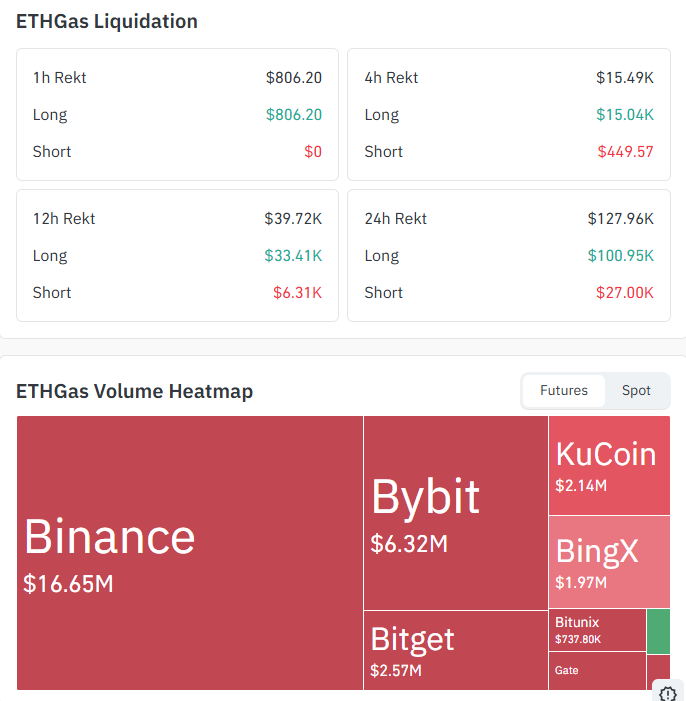
That tells you traders betting on a bounce kept getting stopped out.
Most of the trading volume is concentrated on Binance at $16.65M, followed by Bybit at $6.32M, Bitget at $2.57M, and KuCoin at $2.14M.
That concentration on one or two venues means price can move fast whenever big orders hit.
ETHGas Price Prediction: Short-Term Chart Analysis
On the 1-hour chart, GWEI is trading at $0.051414, well below its 20, 50, 100, and 200 EMAs.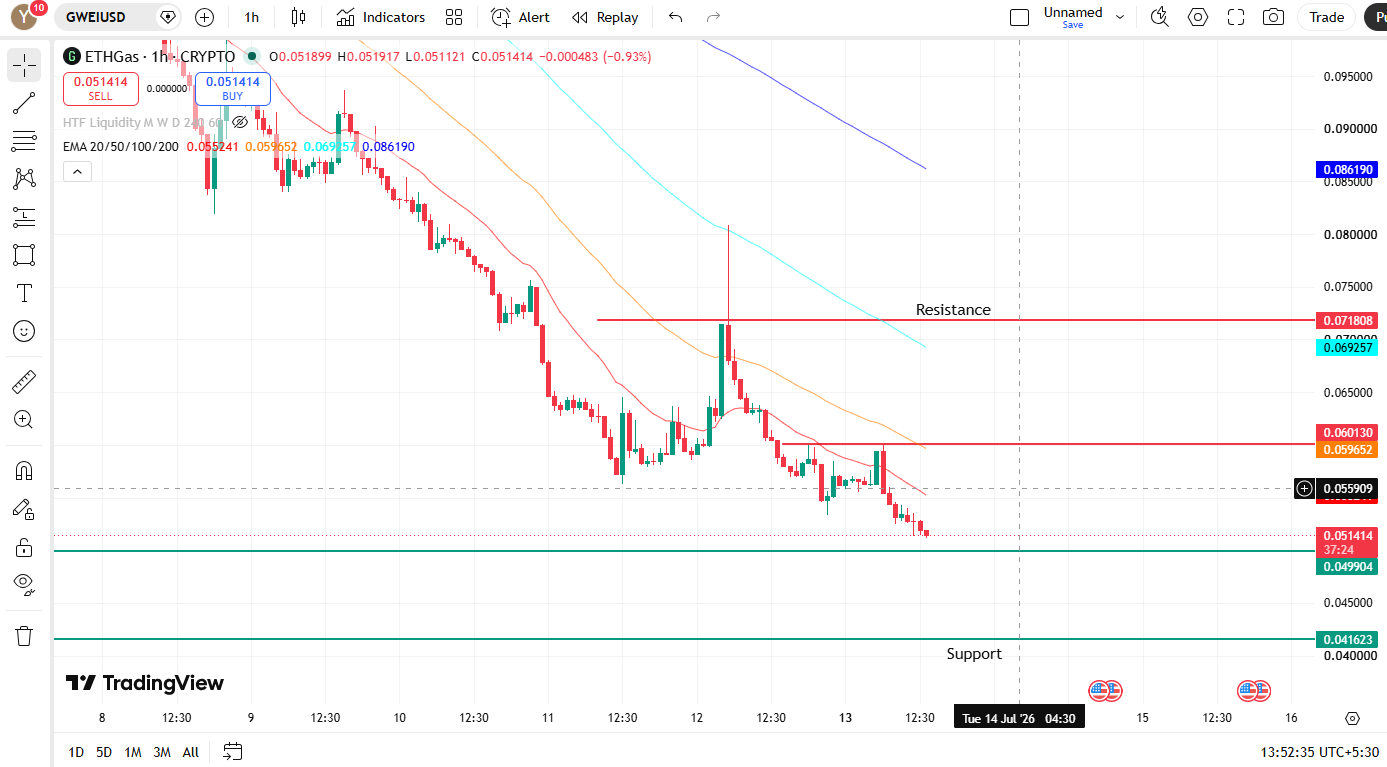
a clear sign sellers still have the upper hand. Every attempt to rally into resistance has been sold into so far.
ETHGas Price Prediction: Short-Term Key Levels to Watch
Level | Price |
Resistance | $0.0601 |
Resistance | $0.0718 |
Support | $0.0499 |
Deeper Support | $0.0416 |
As long as the price stays under the EMA cluster, $0.0499 is the level to watch first.
ETHGas Price Prediction: Long-Term Chart Analysis (Daily)
The daily chart shows a much broader picture. 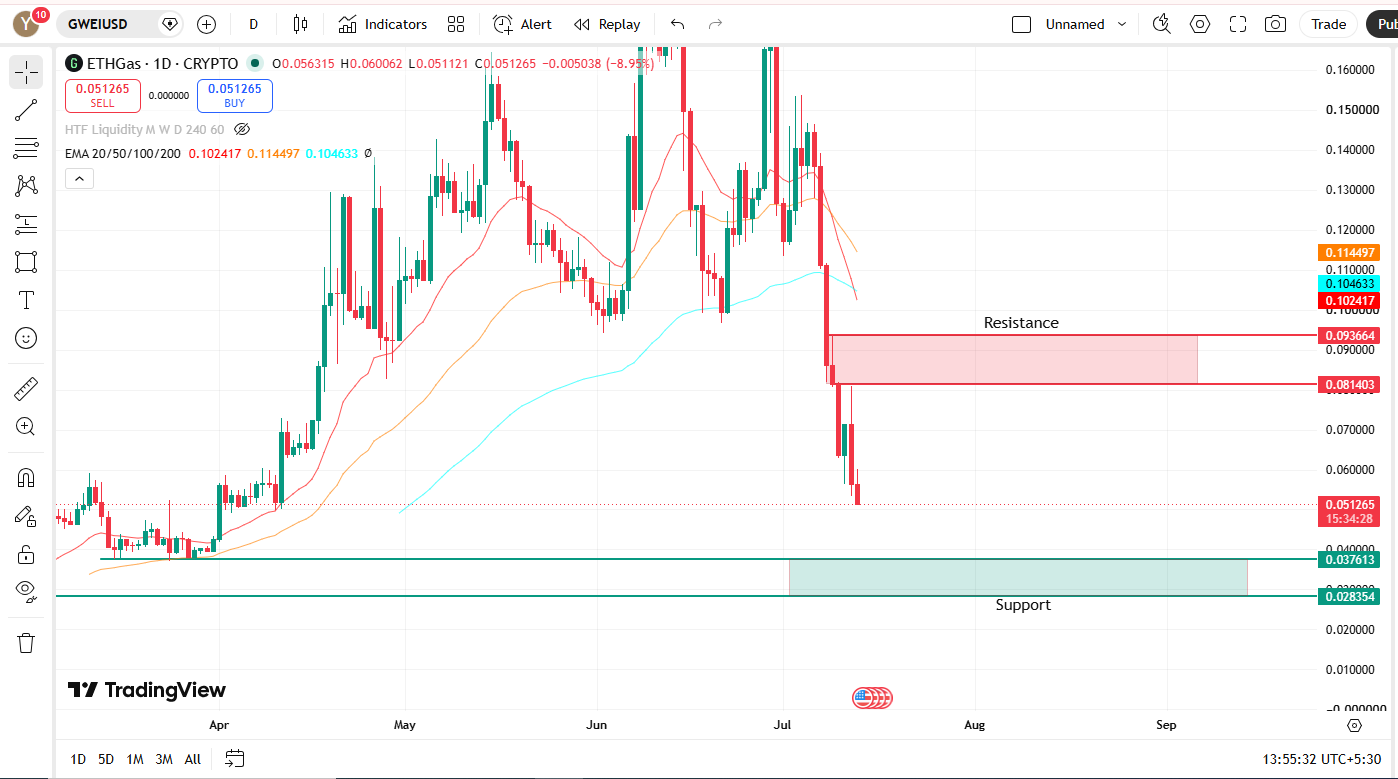
GWEI dropped nearly 15% in a single day and is now sitting right at a major support level.
The daily chart shows a bearish EMA crossover between the 100 EMA ($0.104633) and the 50 EMA ($0.1144).
As long as the price stays below that crossover, any upward move is just a pullback, not a trend reversal; it can retest resistance and still fail to follow through.
A real trend reversal is only confirmed once price reclaims the 100 EMA and the crossover flips bullish. Until then, the broader structure stays bearish.
ETHGas Price Prediction: long-Term Key Levels to Watch
Level | Price |
Resistance Zone | $0.081403 |
Resistance Zone | $0.09366 |
Support Zone | $0.037613 |
Support Zone | $0.028354 |
ETHGas Price Prediction: Expert View
As per the market analyst, the data points to a token still searching for a floor. A hold above $0.0376 on the daily chart would be the first real sign of stabilizing demand.
A break below it opens the door toward the $0.028354 zone. On the upside, reclaiming the $0.0610 resistance on the 1H chart would be the first sign short-term sellers are losing steam.
Disclaimer: This article is for informational purposes only and is not financial advice. Cryptocurrency markets are highly volatile; please do your own research before investing.

















