Official Trump Price Prediction July 2026: TRUMP Ready to Pump?


Trump has been having a rough few weeks, and honestly, most people had stopped paying attention.
But a fresh news cycle just pulled it right back into the spotlight, and the chart is starting to show some signs of life along with it.
This official Trump price prediction July 2026 breaks down exactly what's driving the renewed interest and whether the technicals actually back it up.
Trump's Crypto Income Disclosure Just Went Viral
The story making the rounds right now isn't really about the chart at all; it's about a financial disclosure.
According to figures being widely shared, President Trump personally out-earned every major listed U.S. crypto company in 2025. 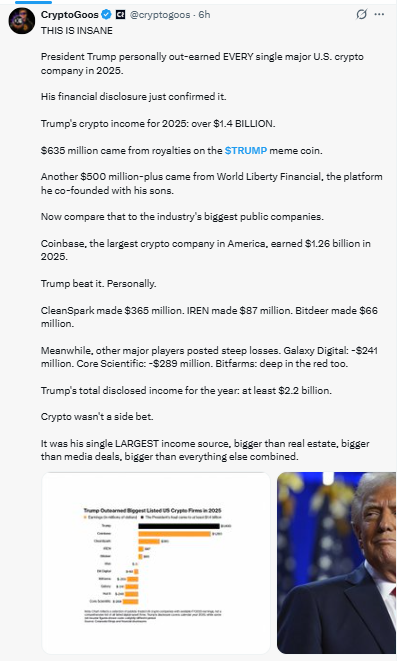
Source: Data Taken From x
His total crypto-related income for the year came in at over $1.4 billion.
Roughly $635 million of that came directly from royalties on the $TRUMP meme coin, with another $500 million-plus tied to World Liberty Financial, the platform he co-founded with his sons.
Put that next to the industry's biggest public players, and it looks even more lopsided. Coinbase, the largest listed crypto company in the country, earned $1.26 billion in 2025, meaning Trump personally out-earned it. CleanSpark made $365 million, IREN made $87 million, and Bitdeer made $66 million. Meanwhile, names like Galaxy Digital and Core Digital posted steep losses last year.
Whatever your take on it, crypto clearly wasn't a side project here; it was his single largest income source for the year, ahead of real estate, media deals, or anything else combined.
And that kind of headline tends to pull eyes back onto the token itself, for better or worse.
The Liquidation Data Tells Its Own Story
Numbers aside from the news, the liquidation data over the last day paints a pretty lopsided picture.
Over the past 24 hours, roughly $345.18K in TRUMP positions got liquidated, and the overwhelming majority of it, about $336.13K, came from longs, with shorts only accounting for around $9.05K. 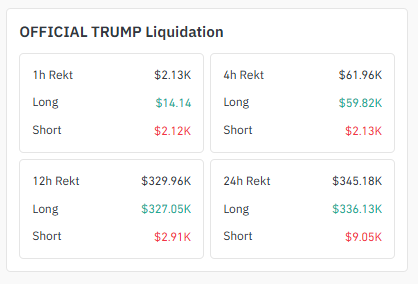
Source: Liquidation Data Taken From Coinglass
The 12-hour window shows the same pattern: $327.05K in long liquidations against just $2.91K in shorts.
The 1-hour window is the one exception here, with a small batch of shorts ($2.13K total, mostly short-side at $2.12K) getting liquidated against just $14.14 in longs, which lines up with the short-term bounce that's been building.
But zoom out to 4-hour, 12-hour, or 24-hour, and longs clearly took the bigger hit through most of this move.
That usually means overleveraged buyers kept trying to call the bottom too early and kept getting flushed out, right before the actual reversal attempt showed up.
Where's the volume actually coming from?
Checking where the volume is flowing matters before trusting any move, and TRUMP's activity is fairly concentrated compared to some other tokens.
Binance is leading by a wide margin at around $30.10M in futures volume, with OKX close behind at roughly $23.24M. 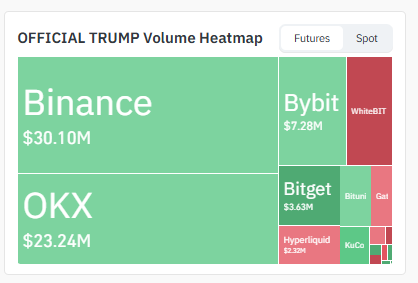
Source: Heatmap Data Taken From Coinglass.
Bybit is pulling in about $7.28M, Bitget around $3.63M, and Hyperliquid contributing close to $2.32M, with WhiteBIT, Bitunis, Gate, and KuCoin rounding out smaller amounts.
Two exchanges carrying most of the weight isn't necessarily a red flag for a token like this since Binance and OKX are both deep.
liquid markets, but it's still worth knowing that this move isn't spread evenly across the board.
4-Hour Chart Analysis for Official Trump Price Prediction July 2026
On the 4-hour timeframe, TRUMP has been stuck inside a clean descending channel for weeks, with price currently sitting right near the channel's lower boundary around $1.552, just above the $1.524 support shelf.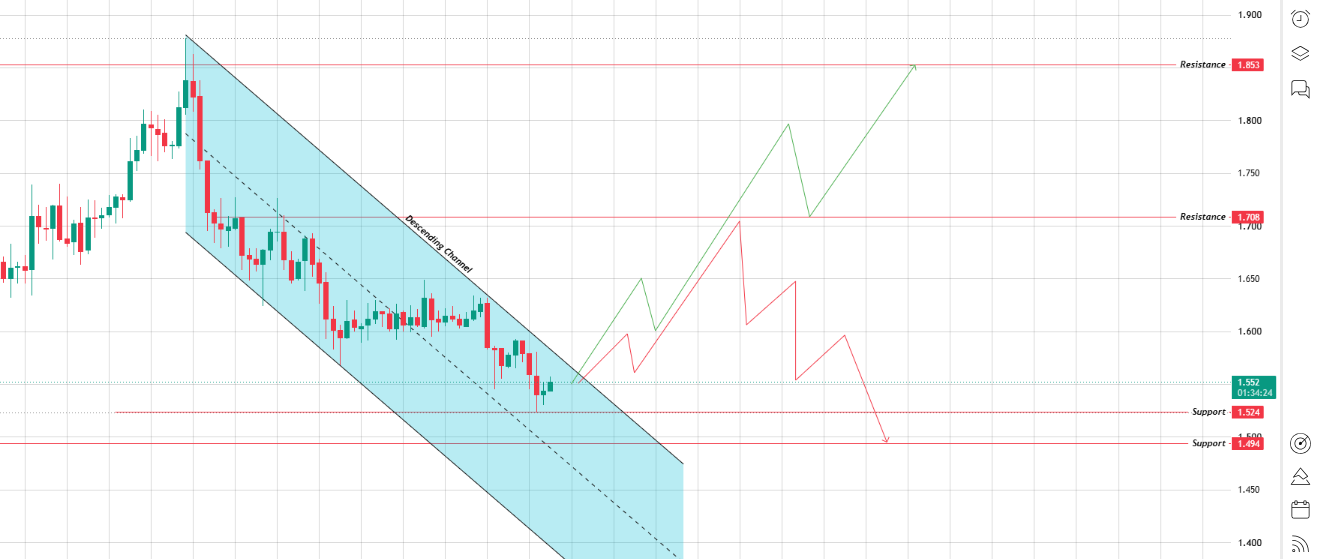 Source: Chart Taken From TradingView.
If price breaks out above the channel's upper trendline and holds, the path opens up toward $1.708 first, and then $1.853 if buyers keep control from there. That's the bullish read.
But if the channel holds and the price stays trapped inside it instead of breaking out, the more likely path is a slide back down toward $1.524, and a loss of $1.494 would open the door to a much deeper move lower.
Right now, price is sitting right at the decision point inside the channel, testing its lower edge, with the break (or lack of one) determining which of these two paths plays out.
What Does The $TRUMP Daily Chart Show?
Zoom out to the daily chart, and it's the same story, just slower.
TRUMP has been sliding down a clean descending trendline for weeks, and every single bounce so far has been sold straight back into it.
This trendline has been respected the entire way down.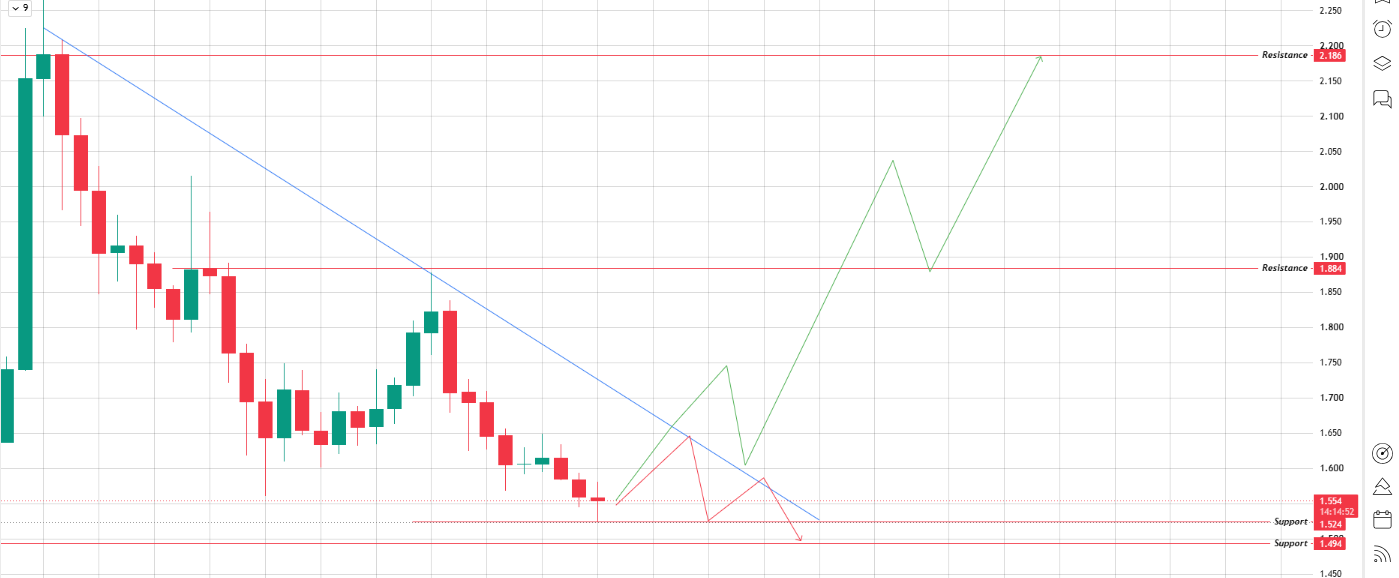
Source: Chart Taken From TradingView.
If price finally closes above it and holds, that opens the door toward $1.884 first, and $2.186 becomes the next real target if the move actually has legs behind it. Until that trendline actually breaks on a daily close.
Though the structure is still technically bearish, $1.524 stays the support to watch, with $1.494 as the level that would put the whole reversal case in serious doubt if it gives way.
| Level Type | Price (USD) | What It Means |
|---|---|---|
| Major Resistance (Bull Target) | 2.186 | The primary upside target if the bullish reversal is fully confirmed. |
| Resistance 1 | 1.884 | A move above this level confirms the trendline breakout has strength. |
| Support 1 | 1.524 | A key support level where buyers have been defending the current move. |
| Deep Support (Invalidation) | 1.494 | A break below this level would invalidate the current bullish outlook. |
| Scenario | Key Level | Next Target |
|---|---|---|
| Bullish Breakout Confirmed | Close and hold above $1.884 | Potential rally toward $2.186. |
| Rejection at Resistance | Fails to hold above $1.884 | Likely retest of the $1.524 support level. |
| Bulls Lose Control | Breaks below $1.494 | Risk of a deeper correction toward new lows. |
Bottom Line
Trump is sitting right at a decision point on both timeframes: a descending channel on the 4-hour that's being tested right at its lower edge and a falling trendline it's been respecting for weeks on the daily.
The liquidation data suggests there's some real substance behind this attempt since longs took the bulk of the damage on the way down rather than shorts getting squeezed on the way up.
But nothing's confirmed yet. Until TRUMP actually closes above these trendlines rather than just poking at them, this is still a downtrend that hasn't been broken, just one that's finally being challenged.
Disclaimer: This article is for informational purposes only and should not be considered financial or investment advice. Cryptocurrency markets are highly volatile and unpredictable. Always do your own research and consult a licensed financial advisor before making any investment decisions. Past performance is not indicative of future results.
Also read:

















