Hedera Price Prediction: Can HBAR Recover After Long Liquidations?


Hedera's native token HBAR is currently trading near $0.06819, down 1.92% over the past 24 hours, as the market weighs a mildly bullish four-hour bounce against a technical structure that has been grinding lower since the spring.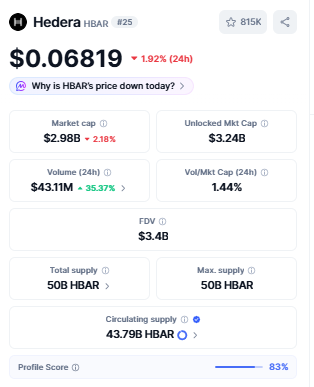
That contrast puts the latest Hedera price prediction in an awkward spot: short-term price action is trying to stabilize while the broader chart is still carrying months of damage.
The token's market capitalization sits at roughly $2.98 billion on a circulating supply of 43.79 billion HBAR, out of a fixed maximum of 50 billion, putting circulating supply at about 87% of total issuance.
Trading volume over the last 24 hours climbed 35.37% to $43.11 million, a pickup that suggests renewed participation even as the spot price stays under pressure.
Zooming out, the performance picture is mixed depending on the timeframe.
HBAR is up 1.08% over four hours and 2.29% over the past week, but it remains down 5.04% for the month, 23.31% over 90 days, and a steep 76.61% over the past year.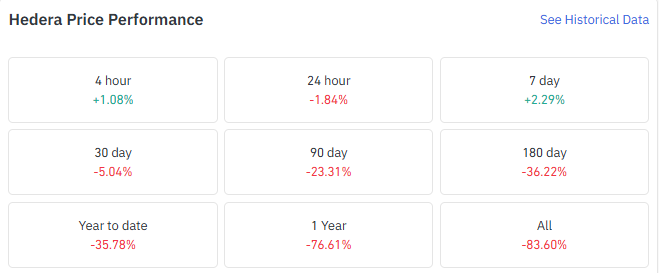 That split between a tentative near-term recovery and a badly damaged longer-term trend is exactly what the technical setup below has to resolve.
Can HBAR Break Its Falling Channel on the 4-Hour Chart?
On the four-hour chart, HBAR has been confined to a descending channel for weeks, bouncing between lower highs and lower lows.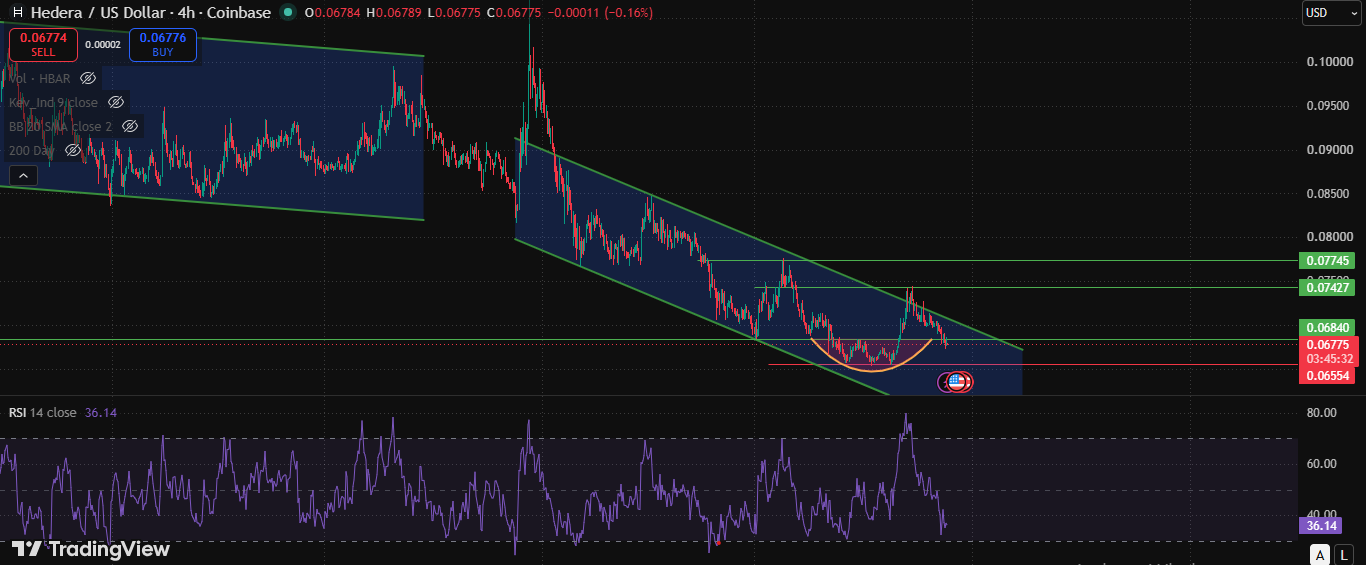
Price is currently testing the $0.0682 zone, with immediate resistance stacked at $0.07427 and $0.07745, and support marked at $0.06554.
Inside that range, candles have carved out a rounded base, a pattern chart-watchers use to flag slowing downside momentum rather than an outright reversal.
The 14-period RSI on the four-hour chart reads 36.14, still below the neutral 50 line but recovering from oversold territory, consistent with the idea that sellers are losing some of their grip without bulls yet taking control.
Traders building out a full HBAR technical analysis will want to watch whether price can close and hold above the $0.07427 level.
Since that would flip the nearest resistance into support and open a path back toward the upper channel boundary.
What Is the Daily Chart Suggesting for Hedera?
The daily chart tells a longer story: a steep descending channel that began after HBAR topped out near $0.10 and accelerated through a sharp breakdown in June.
Daily RSI sits at 43.42, roughly in the middle of its range, reflecting the token's recent stabilization rather than a strong trend in either direction.
Worth tracking for anyone weighing a Hedera price prediction over the coming weeks.
A daily close beneath $0.06554 would likely reopen the channel's lower boundary.
Data source: TradingView.com
What Are HBAR Derivatives Traders Signaling?
The open-interest-weighted funding rate has stayed mostly positive in recent sessions, last printing around 0.0048%, meaning long positions have generally been paying shorts.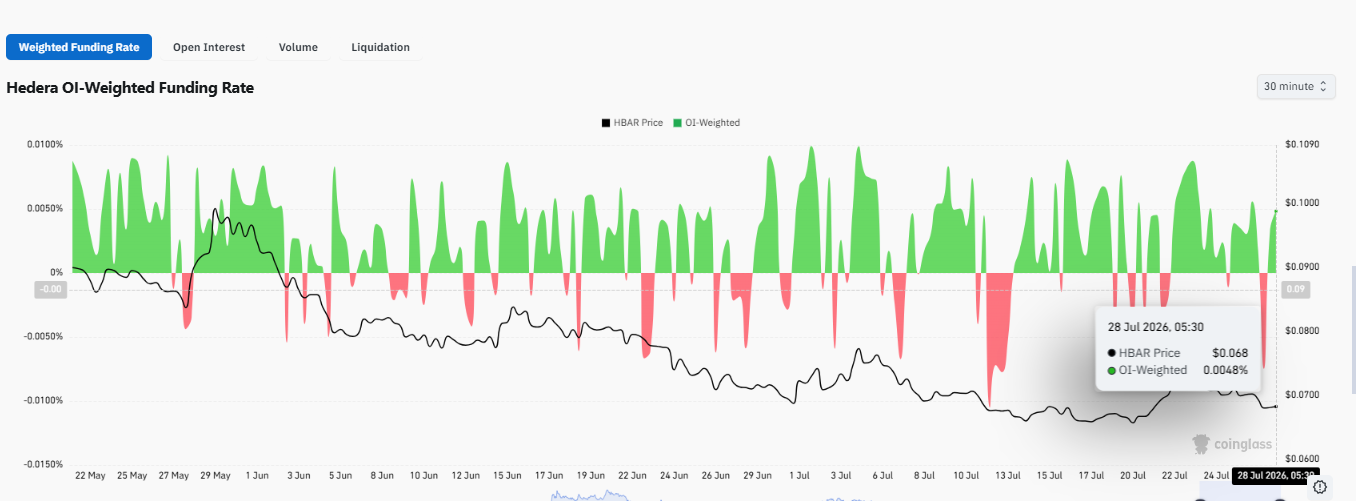
A sign that leveraged traders have kept a bullish tilt even while the spot price has drifted lower.
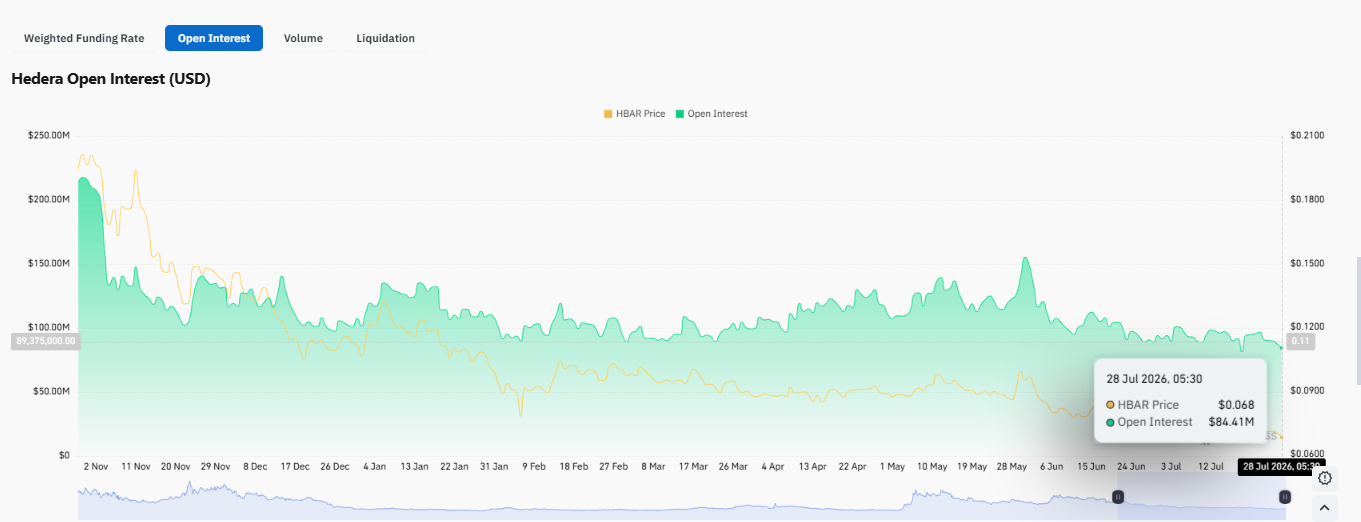
Total open interest across HBAR futures currently stands near $84.41 million, well below the roughly $200 million-plus peaks recorded last November.
But noticeably higher than the multi-month lows the metric touched earlier this year, pointing to fresh capital re-entering the derivatives market.
That renewed leverage has come with a cost.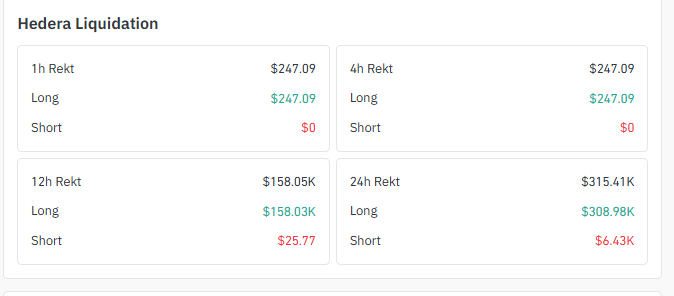
Liquidation data shows $315.41K wiped out over the past 24 hours, and the damage was overwhelmingly one-sided: long positions accounted for $308.98K of that total against just $6.43K in short liquidations.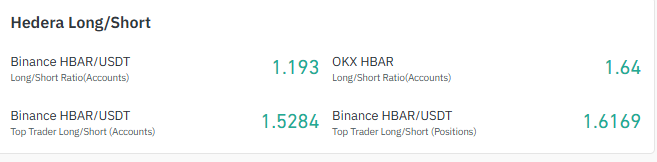
Positioning data backs up the picture of a crowded long trade—the Binance HBAR/USDT account long/short ratio sits at 1.193; OKX's ratio is higher at 1.64; and top-trader accounts on Binance are even more skewed toward longs, with ratios of 1.5284 by account and 1.6169 by position size.
For anyone digging into the broader crypto derivatives market outlook, HBAR is a useful case study in how a lopsided long base can amplify downside moves if spot price fails to hold key support, since forced selling from liquidated longs tends to accelerate whatever move is already underway.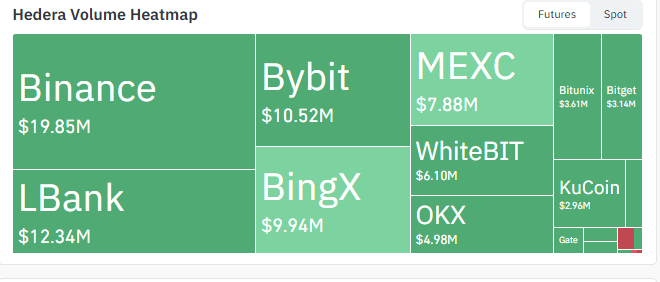
Trading activity remains concentrated on a handful of venues. Binance leads HBAR futures volume at $19.85 million over the tracked window, followed by LBank at $12.34 million, Bybit at $10.52 million, BingX at $9.94 million, and MEXC at $7.88 million, with smaller contributions from WhiteBIT, OKX, KuCoin, Bitunix, and Bitget rounding out the rest.
HBAR derivatives data directly for updated funding, open interest, and liquidation figures.
What Does the Utila Integration Mean for Hedera?
On the fundamental side, Hedera announced a partnership with Utila on X, a platform built around Utila's institutional custody infrastructure, to bring institutional-grade custody and wallet tooling to the network.
The integration is designed to give builders operational controls and key-management capabilities for managing.
HBAR and Hedera Token Service (HTS) assets at scale, a category of infrastructure that has historically been a gating factor for larger institutions considering exposure to newer networks.
Moves like this matter for a network that has positioned itself around enterprise and regulated-market use cases rather than purely retail speculation.
Custody infrastructure doesn't move price on its own, but it does lower the operational barrier for treasuries, funds, and enterprises to hold and move HBAR and HTS tokens, which can matter more for medium-term demand than any single day's chart pattern.
Hedera's broader ecosystem shows how custody integrations like Utila fit into the network's expanding infrastructure for enterprise and institutional use.
What It Means Going Forward?
Put together, HBAR's setup looks like a market in transition rather than one with a clear directional edge.
The technical structure still favors sellers until price reclaims the $0.0743–$0.0775 resistance zone on a closing basis, but the rounded bottom based on lower timeframes, recovering RSI, and a pickup in spot volume all point to fading downside momentum.
Derivatives markets are leaning long and funding remains positive, which is constructive if spot follows through but leaves the trade vulnerable to another round of long liquidations if $0.06554 support gives way.
Meanwhile, the Utila integration adds a genuine fundamental data point in Hedera's favor, even if it's unlikely to move the four-hour chart. Traders will want to watch the $0.06554–$0.07427 range as the key battleground over the next several sessions.
Conclusion
As per the CoinGabbar analysts, HBAR remains range-bound between roughly $0.0655 and $0.0743 as of this writing, with technical indicators showing tentative stabilization after a brutal multi-month downtrend.
Positive funding, rebuilding open interest, and a long-skewed derivatives market suggest traders are cautiously betting on a bounce, though the heavy long liquidations over the past day are a reminder of how quickly that positioning can unwind.
Longer term, Hedera's push into institutional-grade infrastructure through the Utila partnership is a fundamental tailwind worth tracking alongside the charts.
Disclaimer: This article is for informational purposes only and does not constitute financial, investment, or trading advice. Cryptocurrency markets are highly volatile, and prices can change rapidly. Data referenced reflects a specific point in time and may no longer be current. Always conduct your own research and consult a qualified financial advisor before making investment decisions.