Hedera Price Prediction: Can HBAR Hold Its Breakout Structure?


HBAR has spent the last few sessions doing something it hasn't managed in a while, holding its ground after a breakout instead of immediately giving it back.
Whether that turns into something more meaningful is the question traders are now sitting with.
Where Does HBAR Stand After a Rough Few Months?
Hedera Price Prediction, $HBAR is currently trading at $0.07089, down 2.47% over the past 24 hours, with a market cap sitting near $3.1 billion. Zoom out a little and the picture gets messier. Data source from CoinMarketCap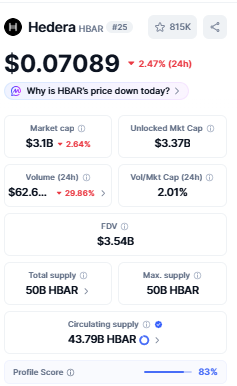
The token is down 8.50% over 30 days and 22.07% over 90 days, though it did manage a 6.52% gain on a 7-day basis. The longer timeframes are still bruising,
$HBAR remains down 71.09% over the past year and 82.96% from its all-time high.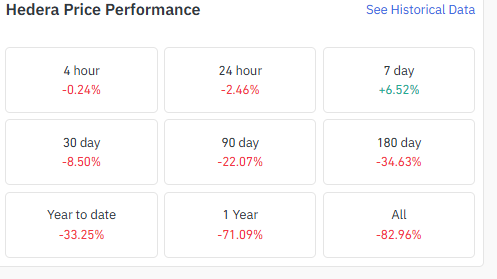
That context matters for any Hedera Price Prediction right now, because short-term strength is happening against a backdrop of a market that's still recovering from a much deeper drawdown.
Data source from CoinGlass
How Is the 1-Hour Chart Reacting to the Breakout?
On the hourly timeframe, HBAR broke above its earlier ascending trendline and is now retesting that same breakout area, which is fairly normal behavior after a move like this.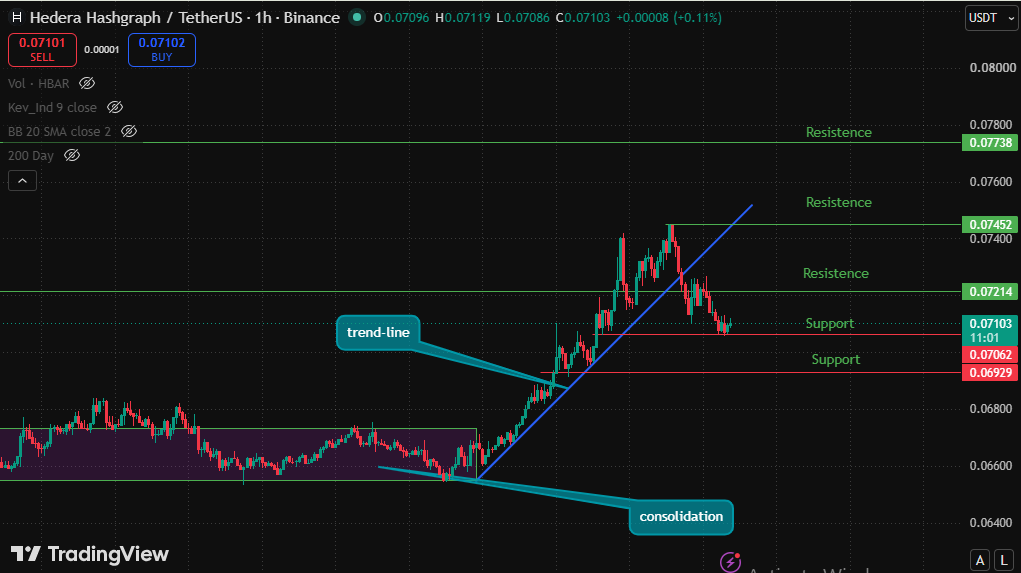
Immediate support sits at $0.07062, with a second layer of support below at $0.06929.
On the upside, resistance comes in first at $0.07214, followed by $0.07452, and then a heavier ceiling at $0.07738.
If price holds above the retested trendline and clears $0.07214 with some conviction, it opens the door toward those higher levels.
Losing $0.07062, though, would put the breakout structure back in question.
What Is the Daily Chart Telling a Different Story?
The 1-day chart shows something a bit more constructive in shape, a rounding bottom pattern that's been building over time.
That said, a descending trendline is still capping prices from above, acting as higher-timeframe resistance.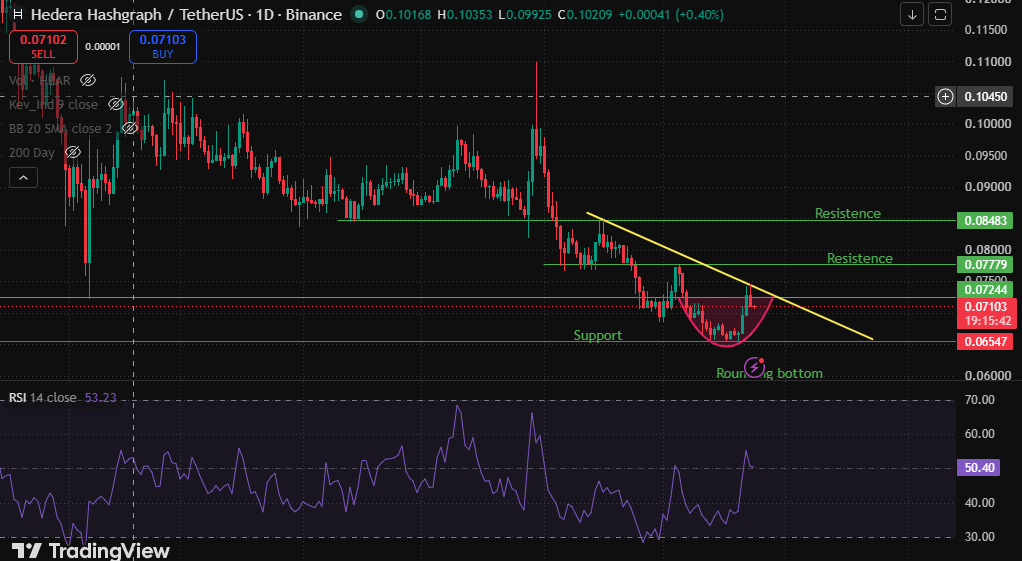 Data source from TradingView
First resistance on this chart sits at $0.07779, with the major level up at $0.08483.
RSI is reading 50.40, which is neither overbought nor oversold, just sitting in fairly neutral territory.
This Hedera Price Prediction leans on the idea that the daily chart needs a clean break of that descending trendline before the rounding bottom can really be taken seriously as a reversal setup.
What Are Open Interest and Funding Showing Right Now?
Open Interest currently sits at $90.87 million, a fraction of the levels seen earlier in the year when it briefly touched the $400 million range.
That kind of pullback in OI usually points to reduced leverage in the system rather than an imminent squeeze in either direction.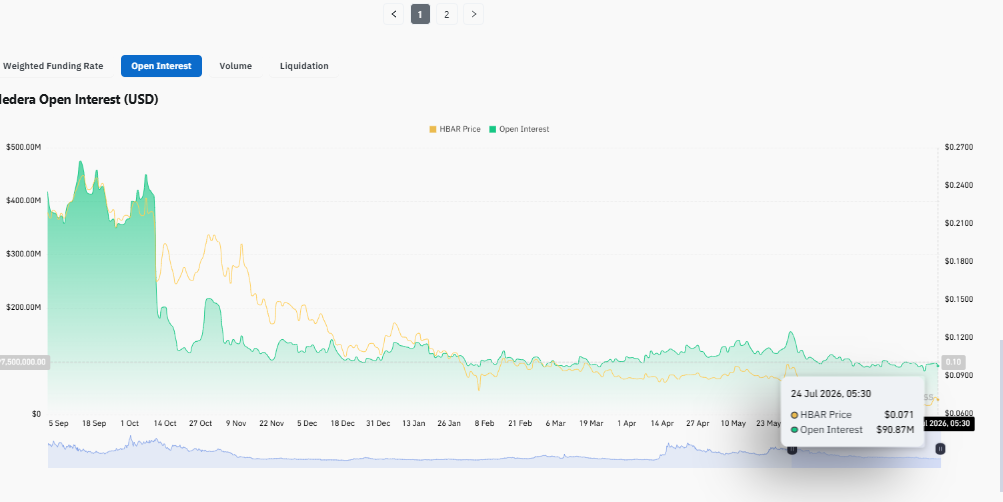
Funding is sitting at a mild +0.0045%, which is close to neutral and doesn't suggest traders are aggressively paying up to stay long or short.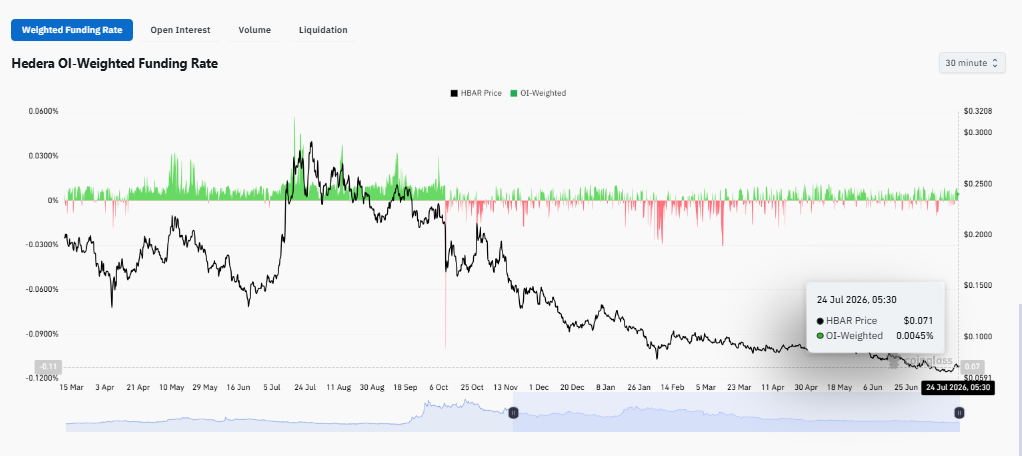
Taken together, this doesn't look like a market bracing for a violent move, it looks more like one that's cooled off and is waiting for a catalyst.
Data source from CoinGlass
Which Exchanges Are Driving HBAR's Futures Volume?
Futures activity remains spread across several venues rather than concentrated in one place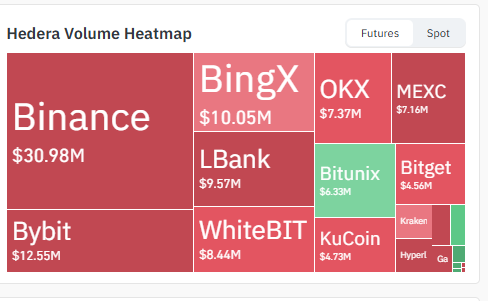
Binance leads the heatmap at $30.98 million, with Bybit at $12.55 million, BingX at $10.05 million, and WhiteBIT close behind at $8.44 million. OKX, LBank, MEXC, Bitunix, KuCoin, and Bitget all contribute smaller but active volumes.
Total 24-hour volume across the board sits near $62.6 million, down close to 29.86% from the prior day. Spread-out volume like this generally reflects steady trading interest rather than one exchange driving a coordinated push.
What Do Liquidations and Positioning Reveal?
HBAR saw about $118.80K in liquidations over the past 24 hours, and longs took most of the damage at $84.98K against just $33.82K on shorts.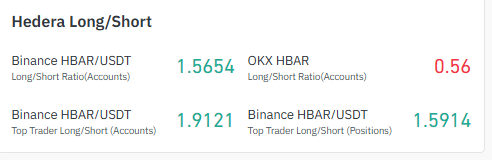
The shorter windows show the same tilt, longs losing more in both the 4-hour and 12-hour data, though the 1-hour snapshot briefly flipped the other way with shorts wiped out entirely.
Positioning backs this up on Binance, where the account long/short ratio sits at 1.5654 and climbs to 1.9121 among top traders, a clear long lean.
OKX tells a different story though, sitting at just 0.56, favoring shorts. So the bias really depends on which exchange you're looking at.
Data source from CoinGlass
What Is the Expert View on the Current HBAR Setup?
CoinGabbar analysts would likely describe the current $HBAR setup as constructive but unconfirmed.
The hourly breakout and the daily rounding bottom both suggest early signs of stabilization, yet Open Interest remaining well off its highs and funding sitting near flat point to a market that hasn't fully committed to a direction.
The divergence in long/short ratios across exchanges, strongly long-leaning on Binance but short-leaning on OKX, reinforces the idea that conviction is split rather than one-sided.
Hedera Price Prediction: What Could Decide the Next Move?
The setup right now comes down to a handful of levels doing the talking.
Holding above $0.07062 and clearing $0.07214 on the hourly chart would strengthen the near-term recovery case,
while a break of the daily descending trendline near current levels would add weight to the bigger rounding bottom pattern.
On the other hand, losing $0.06929 support or seeing funding and Open Interest drift further into weakness would leave HBAR vulnerable to renewed selling pressure.
For now, this Hedera Price Prediction stays scenario-based rather than fixed, with confirmation still needed on both timeframes before the recovery story can be called anything more than early stage.
Disclaimer: This article is for informational purposes only and should not be considered financial or investment advice. Cryptocurrency markets are highly volatile, and prices can change rapidly based on numerous factors. Readers should conduct their own research and consult a qualified financial advisor before making any investment decisions.
Also read:

















