Heima Price Prediction 2026: Can $HEI Break Above $0.27?


A quiet AI-agent infrastructure token just doubled in a day, and it did not happen on hype alone. It broke a pattern weeks in the making. Does this hold or fade fast?
Why Everyone Is Suddenly Watching This AI Token
Heima price prediction searches are climbing fast this week. A token most traders had written off just posted one of the sharpest reversals in the small-cap market.
It is not random. There is a chart pattern behind it, an active builder team, and real money behind the trade.
Here's the thing: moves like this usually come with a catch. Either the breakout has legs, or it traps latecomers. Whales also control most of the supply, and that changes how this setup should be read.
Table of Contents
Why HEI Is Moving Today
Daily Chart
Weekly Chart
Support And Resistance
Scenarios By Timeframe
Tokenomics And Whale Concentration
Liquidations And Volume
AI Agent Altcoin Narrative
Risks And Catalysts
Glossary
Key Takeaways
HEI trades near $0.1812, up 109.98% in 24 hours per CoinMarketCap, still down 86.74% from its all-time high.
Daily RSI sits at 75.95, overbought; weekly RSI reads 61.45, neutral.
The daily chart confirmed a triangle breakout; the weekly chart just exited a consolidation zone.
Top 10 wallets hold 91.67% of supply; Gini score is 0.9932.
Invalidation for the bullish Heima price prediction sits under $0.0683.
Why HEI Is Moving Today
HEI opened near $0.1289 and hit $0.1867 before settling around $0.1798 on the MEXC daily chart via TradingView. A 39.09% candle.
Volume backed it. Per CoinMarketCap, 24-hour volume jumped 1,065.2% to $69.71M, pushing volume-to-market-cap to 451.11%.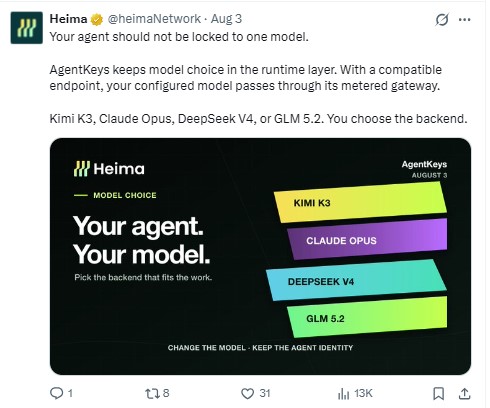
Timing lines up with real news. Heima's team posted about its AgentKeys system on August 3, letting agents run on Kimi K3, Claude Opus, DeepSeek V4, or GLM 5.2 while keeping one identity, per the official X post.
Check a coin events calendar before assuming this stands alone.
HEI Technical Analysis: Daily Chart
HEI trades at $0.1798 on the daily MEXC chart, up from an open of $0.1289, after clearing a descending triangle that had capped the price for weeks. That pattern breaks when buyers finally absorb the lower highs, and today's candle did exactly that on strong volume, not a thin wick.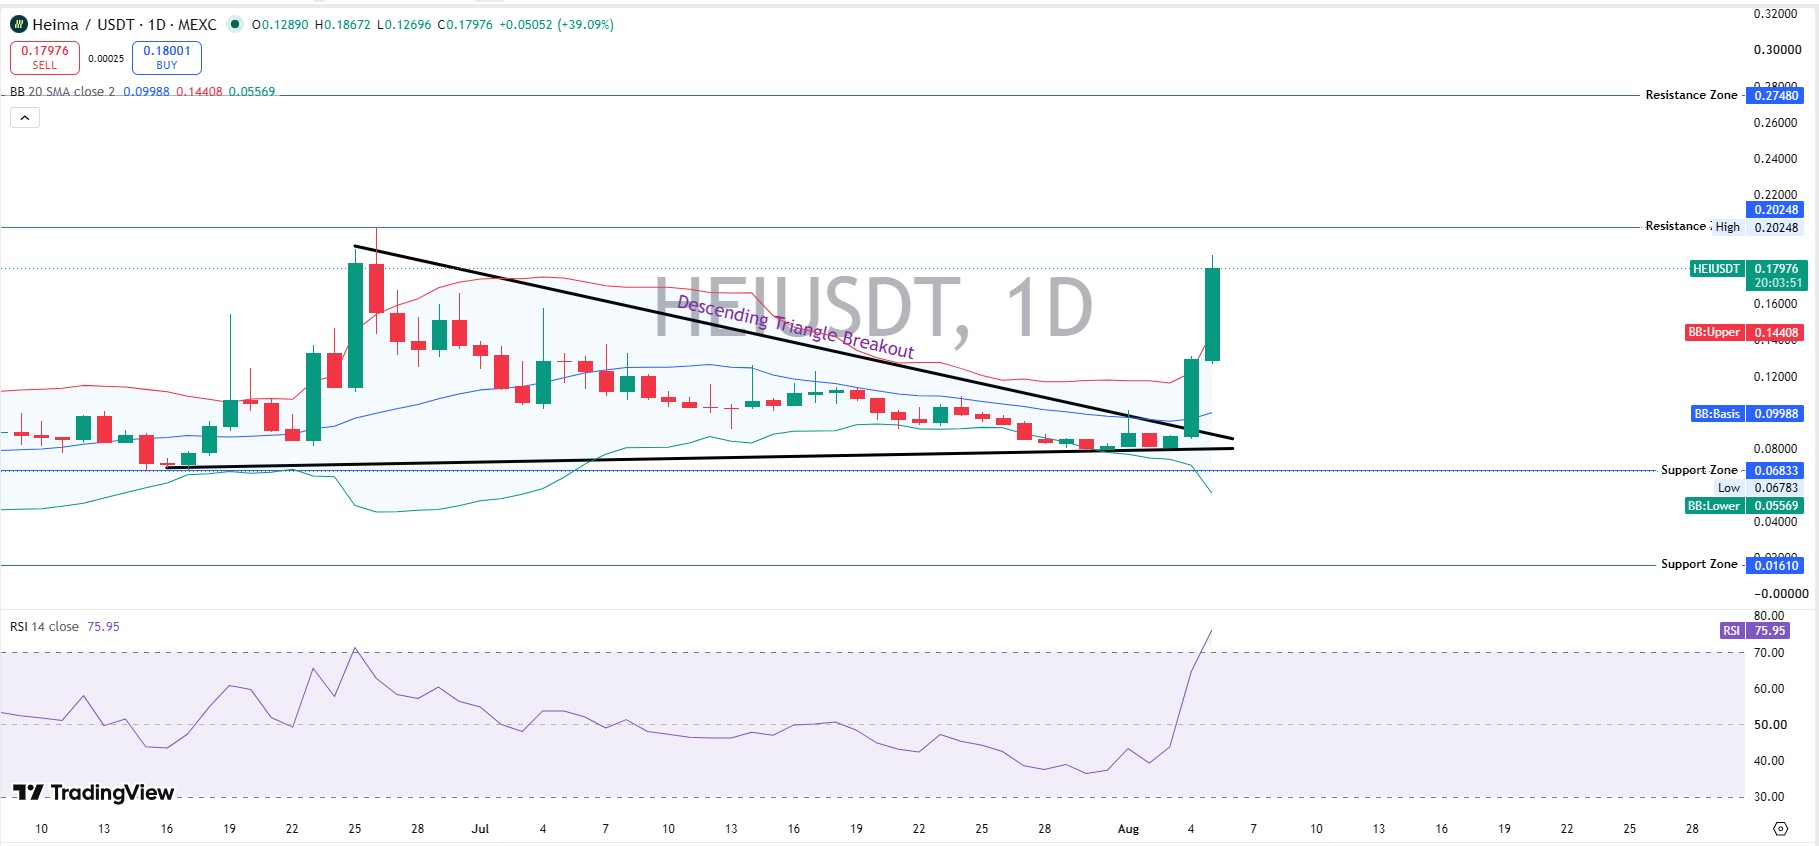
Resistance stacks first at $0.2025, the prior swing high, then $0.2748 further out. Support sits near $0.0683, backed by the 20-period BB lower band at $0.0557, which has held on every pullback since June.
Daily RSI reads 75.95, overbought. That's the tradeoff: strong momentum, but also a stretched short-term read that often cools before it extends. A daily close above $0.2025 would confirm the breakout is extending toward the next resistance band. Losing $0.0683 fast, on the other hand, flips this read back to bearish and puts the whole triangle breakout in doubt.
HEI Technical Analysis: Weekly Chart
Zoom out and the story shifts. HEI spent most of 2026 stuck below $0.20, grinding sideways inside a consolidation zone that ran roughly between $0.07 and $0.20 for months. That kind of tight range usually means supply and demand are balanced, with neither side willing to commit.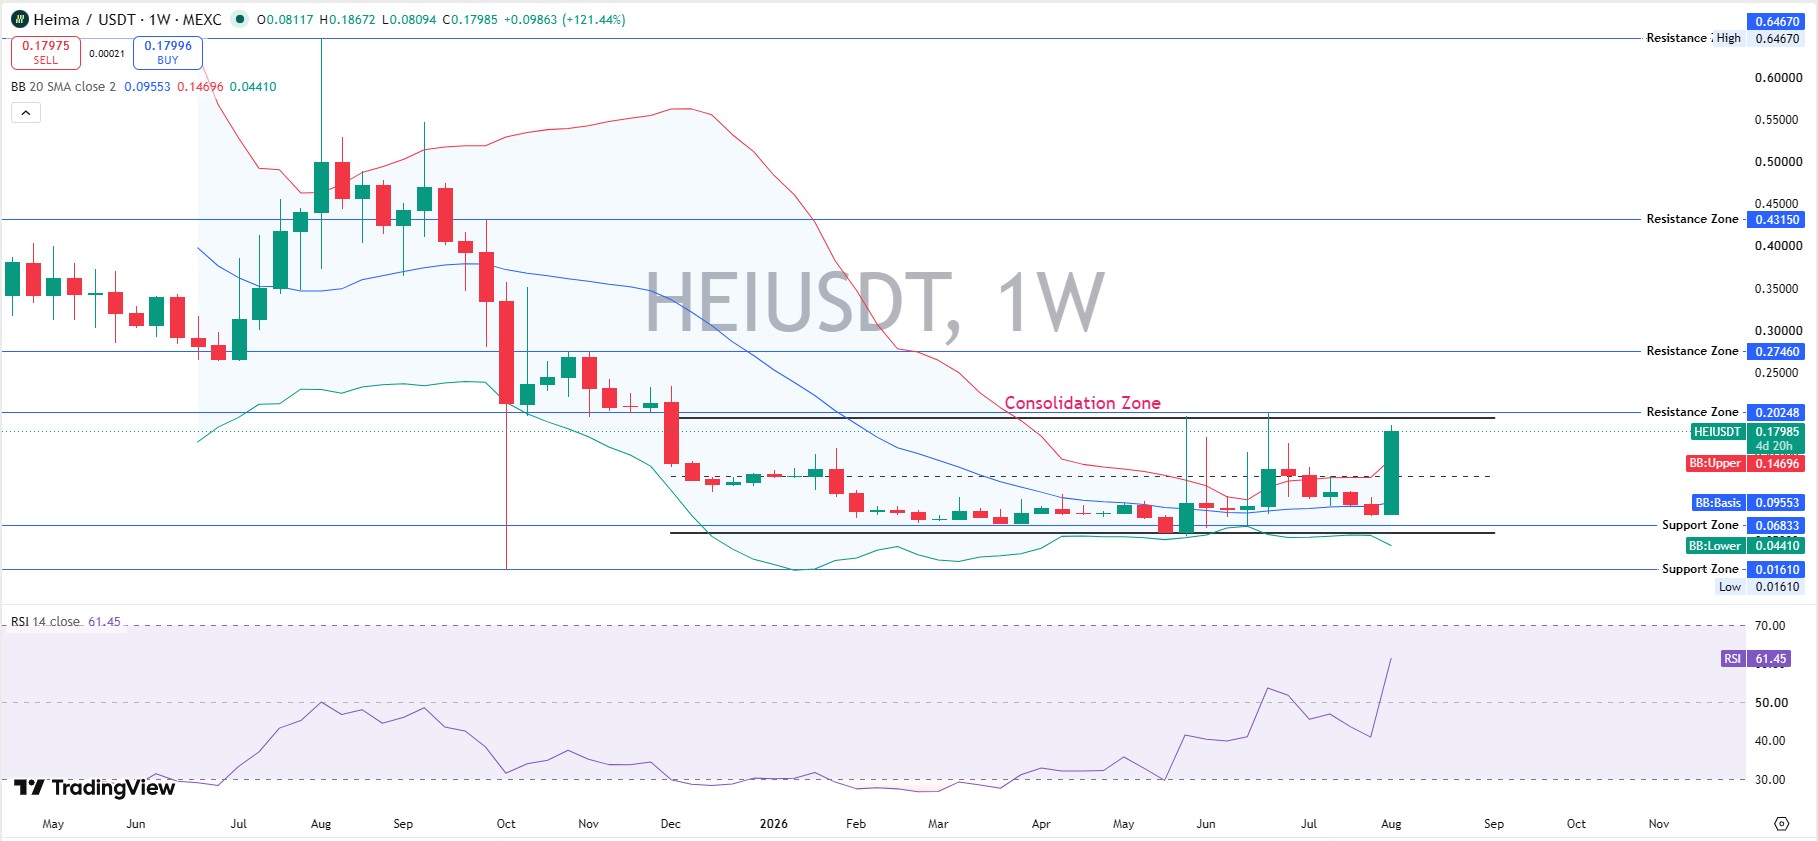
This week's candle finally broke through the top of that zone on a surge in volume, which is what turns a range into a real breakout instead of just another false push. Weekly resistance runs at $0.2746, then $0.4315, then $0.6467. Support holds at $0.0683, right at the old consolidation ceiling, with a deeper floor near $0.0161.
The weekly RSI reads 61.45, short of overbought. Turns out, a breakout on a cooler weekly read tends to carry more follow-through than one that comes from a Bollinger Band range that has stayed flat for weeks. Nothing is confirmed, though, until the price closes above resistance weekly.
HEI Support And Resistance Levels
Support: $0.0683, $0.0557, $0.0161. Resistance: $0.2025, $0.2746, $0.4315.
Heima Price Prediction: Scenarios By Timeframe
Timeframe | Bull | Base | Bear |
24H | Holds $0.18, tests $0.2025 | Chops $0.15-$0.19 | Slips under $0.0683 |
7D | A weekly close above $0.2746 opens $0.4315 | Range-bound at breakout zone | Daily close under $0.0683 fades |
2026 | Continuation targets $0.43-$0.65 | Drifts $0.12-$0.25 | Breaks toward $0.0161 |
Invalidation for the bullish Heima price prediction stays a daily close under $0.0683.
HEI Tokenomics And Whale Concentration
The max supply is 100M HEI, and the circulating supply is 81.26M HEI, giving a market cap near $14.72M and FDV near $18.12M, per CoinMarketCap. Liquidity-to-market-cap runs at just 0.10%, thin enough to turn a good move into a wild one.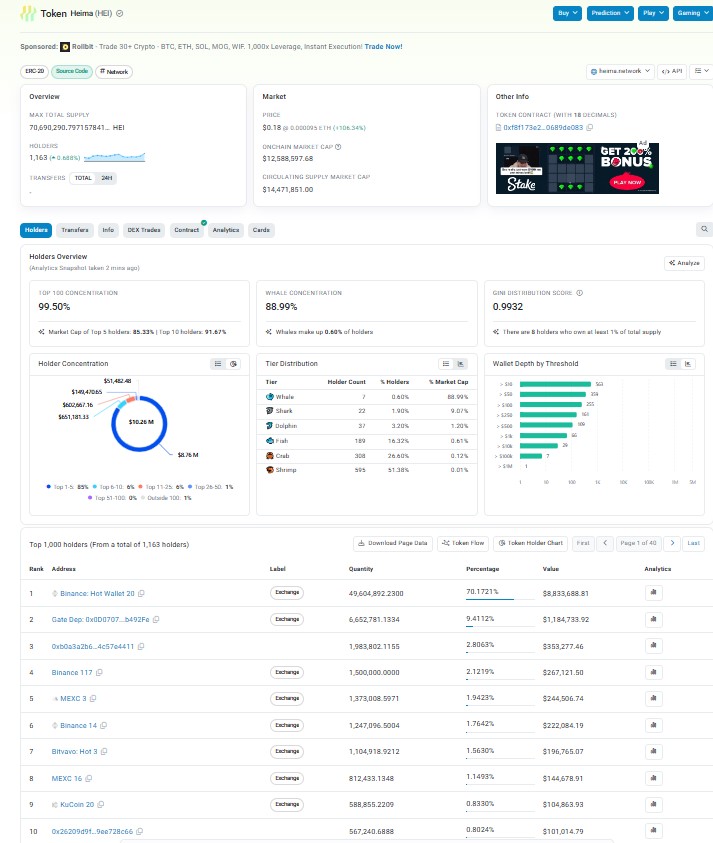
Top 100 wallets hold 99.50% of supply, and the top 10 alone hold 91.67%, per Etherscan wallet data. Whales are just 0.60% of holders yet control 88.99% of market cap.
The Gini score reads 0.9932. Eight wallets each hold over 1% of supply, one Binance hot wallet alone holds 70.17%. CertiK rates the contract 3.8 out of 5.
Liquidations And Exchange Volume
Per CoinGlass, 24-hour liquidations hit $696.83K, split $27.10K longs versus $669.72K shorts. Shorts took the bigger hit. Binance carries the heaviest futures volume at $154.52M, with Bitunix near $19.65M and Bybit close behind, worth checking against the bitcoin price prediction trend for context.
HEI And The AI Agent Altcoin Narrative
Heima is not a meme chart riding a joke. It's agent infrastructure, letting AI agents keep one identity while switching between models like Claude Opus and DeepSeek V4.
That framing pulls capital in whenever broader AI crypto news turns positive. And a 110% daily move on a sub-$15M float does not mean the trend has turned for good.
Heima price prediction search interest keeps climbing alongside ethereum price prediction 2026 searches for relative altcoin risk.
Market Outlook: Risks And Catalysts
Whale concentration tops the risk list. With 88.99% of the cap in 0.60% of wallets, one large sell can crush the price fast. A break below $0.0683 puts HEI back on track toward the $0.0161 zone.
A softer Fed rate decision tends to lift risk appetite across small-cap altcoins, HEI included.
Read the earlier Heima price prediction piece for context on how HEI traded before this breakout.
It's worth checking exchange listing trackers too, since liquidity stays thin everywhere new pairs go live.
Glossary
RSI: A momentum indicator, 0-100; above 70 is overbought, below 30 is oversold.
FDV: Market cap if all 100M HEI were circulated today.
Gini Score: Supply concentration measure; closer to 1 means fewer wallets hold most tokens.
Methodology: Chart levels from the HEI/USDT daily and weekly charts on MEXC via TradingView, RSI-14, and 20-period Bollinger Bands were captured on August 5, 2026, 09:00 UTC. Price and supply data from CoinMarketCap. Holder data from Etherscan; liquidation and volume data from CoinGlass.
Disclaimer
This is speculative market commentary, not financial advice. Crypto assets are volatile and can lose most or all of their value. Verify live figures before trading.


















