Lighter Price Prediction: $LIT Price Trap Area, Breakout Levels?


$LIT is the native token of Lighter, a decentralized perpetuals exchange built on a custom zero-knowledge rollup designed for fast, low-cost on-chain trading.
The protocol positions itself as an order-book-based perp DEX that aims to match centralized exchange speeds while keeping trades verifiable on-chain.
This Lighter Price Prediction looks at where LIT could be headed over the next one to two weeks based on current chart structure, liquidation activity, and holder data.
Here's what the numbers show.
Lighter Price Prediction Today: Market Overview
Metric | Value |
Price | $2.117 |
Market Cap | $527.98M |
FDV | $2.11B |
24h Volume | $34.4M+ |
Vol/Mkt Cap (24h) | 6.49% |
Liq/Mkt Cap | 0.27% |
Total Supply | 1B LIT |
Max Supply | 1B $LIT |
Circulating Supply | 250M $LIT |
Holders | 6.41K |
Source: Data from CoinMarketCap as of August 5, 2026, 09:31 UTC+5:30. Figures may vary slightly across other tracking websites.
Lighter Liquidation and Volume Data
Futures liquidation and exchange volume figures below are sourced from Coinglass and are kept separate from the CoinMarketCap spot volume referenced above.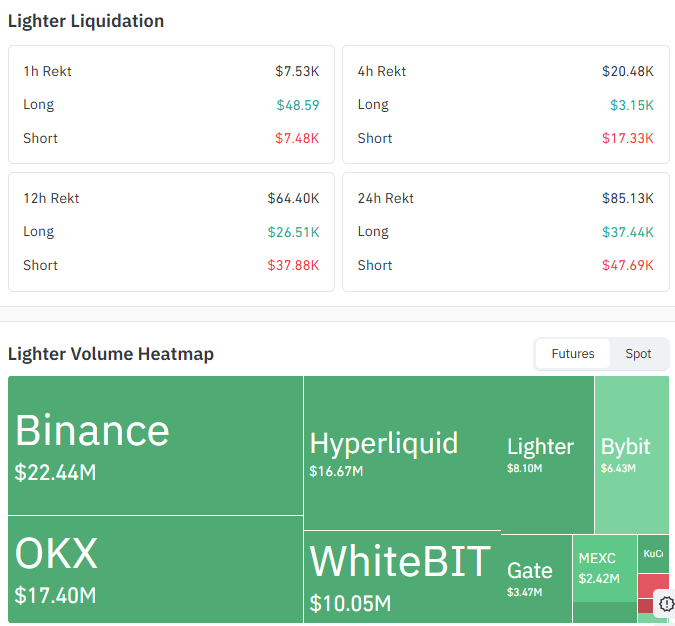
Source: Data From CoinGlass
Window | Total Rekt | Long | Short |
1h | $7.53K | $48.59 | $7.48K |
4h | $20.48K | $3.15K | $17.33K |
12h | $64.40K | $26.51K | $37.88K |
24h | $85.13K | $37.44K | $47.69K |
Short liquidations have outpaced long liquidations across every window shown, and the gap widens the further back the window goes, suggesting short positions have been squeezed as price recovered over the past day.
Futures Exchange Volume (24h)
Exchange | Volume |
Binance | $22.44M |
OKX | $17.40M |
Hyperliquid | $16.67M |
WhiteBIT | $10.05M |
Binance and OKX together account for close to half of the visible futures volume, with Hyperliquid close behind, pointing to fairly broad participation across both centralized and perpetual-focused venues rather than volume concentrated on a single platform.
LIT future price: Lighter Holder Distribution
Holder concentration on LIT remains extremely high. The top 100 wallets control 95.50% of total supply, and whales alone (4.81% of all holders) hold 99.39% of market cap, giving a Gini score of 0.9934. Just 18 wallets hold at least 1% of the total supply each.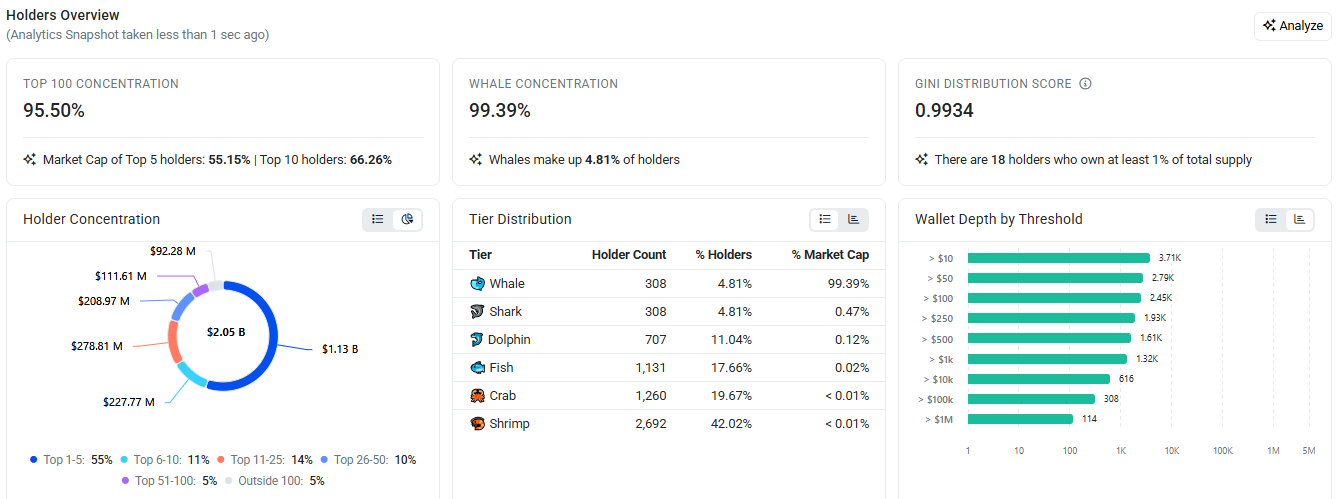
Tier | Holder Count | Holders % | Market Cap % |
Whale | 308 | 4.81% | 99.39% |
Shark | 308 | 4.81% | 0.47% |
Dolphin | 707 | 11.04% | 0.12% |
Fish | 1,131 | 17.66% | 0.02% |
Crab | 1,260 | 19.67% | <0.01% |
Shrimp | 2,692 | 42.02% | <0.01% |
This level of concentration means large-wallet activity can move price more sharply than retail flow, and it's a factor worth watching alongside the technical levels above.
LIT Price Prediction Chart: Technical Analysis
Pair: LIT/USDT · Market: Spot (Crypto) · Exchange: KuCoin · Timeframe: 4H · Source: TradingView · Timestamp: August 5, 2026, 09:31 UTC+5:30
LIT is trading at $2.117, inside a descending channel that has contained price action since the token's early July peak near $2.702.
The channel has narrowed over the past two weeks as lower highs met a flattening lower boundary, and price has spent recent sessions trapped between roughly $1.98 and $2.30.
The EMA cluster (Exponential Moving Average, a momentum indicator that weights recent candles more heavily) kept separate from the channel and horizontal levels below) sits just under the current price, with the 50 EMA at $2.107 and the 20 EMA at $2.070.
Price has reclaimed both lines, and this EMA cluster now works as the Initial Recovery Level the bounce needs to hold above.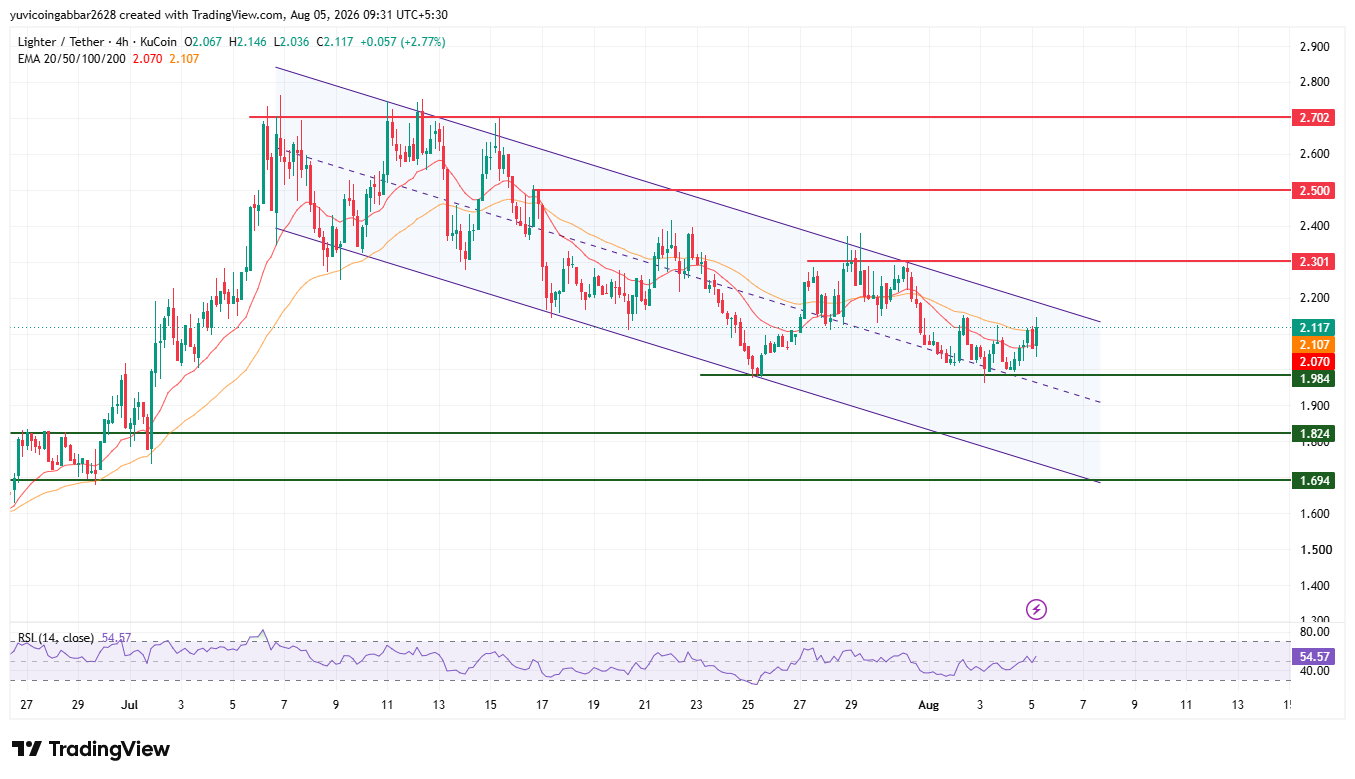
If the price breaks out of the descending channel in either direction, these are the key levels to watch.
Support and Resistance Levels
Level Type | Price |
Resistance 3 | $2.702 |
Resistance 2 | $2.500 |
Resistance 1 | $2.301 |
Immediate Price Reference | $2.117 |
First Support | $1.984 |
Deeper Support | $1.824 |
Structural Floor | $1.694 |
LIT future price: EMA Levels
EMA | Price |
EMA (50) | $2.107 |
EMA (20) | $2.070 |
Lighter Forecast: Bull Case vs. Bear Case
LIT price target 2026 Bull case: Holding above the Initial Recovery Level near $2.070 to $2.107 and above the first confirmed support at $1.984 keeps LIT positioned to test the upper boundary of the descending channel.
A confirmed close above the nearest resistance at $2.301, which also lines up with the channel's upper support, would open the path toward $2.500 and eventually $2.702.
LIT price target 2026 Bear case: A close back below $1.984 would put the recent EMA reclaim in doubt and suggest the bounce inside the channel is fading rather than building.
Losing $1.824 would expose $1.694 as the next downside level, near the bottom of the channel.
LIT price target: Can LIT Reach $2.702?
$2.702 is the highest resistance level marked on the chart.
Reaching it would require LIT to first clear the nearest resistance at $2.301, which sits close to the channel's upper boundary, then hold above $2.500, a move that would likely need the channel structure itself to break rather than a single push higher.
What Could Invalidate the Bullish Setup?
A rejection at the nearest resistance near $2.301 followed by a close back below the EMA cluster at $2.070 to $2.107 would put the recovery in question.
A deeper break below the first confirmed support at $1.984 and the deeper support at $1.824 would expose the structural floor at $1.694 near the channel's lower boundary.
Lighter Price Prediction: Expert View
According to CoinGabbar analysts, the EMA reclaim and the short-heavy liquidation split across the past 24 hours paint a consistent short-term picture:
Buyers have absorbed the recent dip, and short positions have been squeezed on the way back up.
Futures volume spread across Binance, OKX, and Hyperliquid rather than concentrated on one venue suggests the move has drawn participation from multiple corners of the market rather than a single desk pushing prices.
Holder data shows the top 100 wallets control 95.50% of supply with a Gini score of 0.9934, so large-wallet behavior remains a factor worth watching alongside the technical levels above.
The $1.984 to $2.301 zone is the key battleground: holding it keeps the channel-breakout case alive, while losing it would suggest the bounce was a short-term squeeze rather than a trend change.
Lighter Price Prediction 2026: Data Sources
Price and EMA data are referenced from a 4H LIT/USDT chart via TradingView on KuCoin, timestamped August 5, 2026, 09:31 UTC+5:30.
Market cap, FDV, volume, and supply data referenced from CoinMarketCap. Liquidation and exchange volume data referenced from Coinglass.
Holder concentration data referenced from on-chain holder analytics.
Disclaimer: This piece is for informational purposes only and isn't financial advice. The levels and scenarios above are based on technical chart analysis and publicly available data at the time of writing, and crypto markets can move sharply within hours, so past patterns don't guarantee future outcomes. It's worth doing independent research and considering your own risk tolerance before acting on any of the levels discussed here.


















