HOODIE Price Prediction: Can Robinhood Chain Fuel More Gains?


A brand new coin just went from almost nothing to a market darling in barely a day, and traders cannot stop talking about it. What happens after a move this fast rarely follows a simple script, and that is exactly what makes this one worth watching closely.
HOODIE Price Prediction: Why Everyone Is Suddenly Watching This Coin
HOODIE price prediction chatter has exploded this week, and it is not hard to see why. A coin that barely existed yesterday just handed early buyers a return most people only dream about.
Turns out, this kind of move does not happen quietly. Wallets got busy. Screens got refreshed every few minutes.
Basically, what started as a small meme launch turned into one of the more talked-about charts among top memecoins right now. Traders jumped in, volume followed, and the price action did the rest.
But speed like this always raises a question. Can a move built this fast actually hold its ground?
That question is exactly what we are digging into here, using the actual chart structure, the current market data, and the numbers behind the token itself, not just the hype around it.
Coin Snapshot: HOODIE Price Today at a Glance
| Field | Detail |
|---|---|
| Coin Name | HOODIE |
| Ticker Symbol | HOODIE |
| Blockchain | Robinhood Chain (Ethereum Layer-2) |
| Today High | $0.02202 |
| Today Low | $0.01906 |
| RSI Level | 74.85 |
| Token Type | Memecoin |
| Token Category | Meme, Robinhood Ecosystem |
| Market Cap | $20.67M |
| 24H Trading Volume | $45.437M |
| Circulating Supply | 1,000,000,000 HOODIE |
| 24H Change | +1847.8% |
Source: Data by CoinMarketCap
What Exactly Is HOODIE, and Why Did It Launch Now?
HOODIE is a memecoin that launched on Robinhood Chain, a new Ethereum Layer-2 network. It went live on July 10, 2026, barely a day before this rally began.
The idea is simple: a hoodie wearing mascot character built around community energy rather than any complex use case. And that simplicity is part of the appeal for meme traders.
HOODIE Price History and How Fast It Actually Moved
The numbers here are wild. HOODIE went from an all-time low of $0.0005791 on July 10 to an all-time high of $0.02126 within about a day.
That is a move of over three thousand percent from bottom to top. It is currently trading a few percent below that peak, sitting near $0.02067.
Why This Robinhood Chain Coin Matters Beyond the Hype
This is not a coin with a bank partnership or a government contract behind it, and we should be upfront about that. What it does have is real, visible trading activity.
Daily volume of over $45 million against a $20 million market cap is not nothing. Buy orders have outpaced sell orders on chain, with net buying of roughly $184,000 tracked in recent activity, and that kind of imbalance tends to draw more attention rather than less.
This kind of move also tends to line up with what is happening in the broader crypto market rally, where risk appetite across small caps has been climbing alongside majors like Bitcoin.
HOODIE Launch Confirmed Directly on Robinhood Chain
The project's own account confirmed the launch this week, posting the official contract address and tagging the Robinhood ecosystem directly. That kind of direct confirmation matters for a token this new, since fake contract addresses are common in memecoin launches.
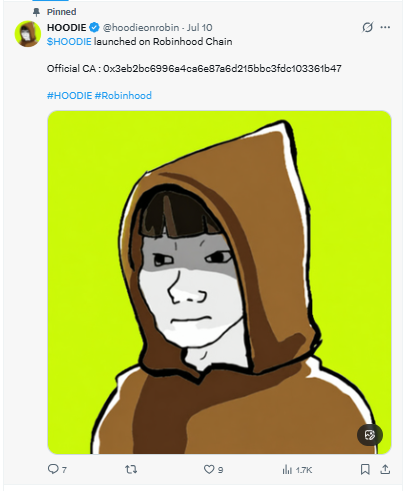
Source: Posted on X by hoodieonrobin
HOODIE Tokenomics and What the Fundamentals Actually Show
There is no team allocation or vesting detail publicly broken down here, which is common for meme launches. Supply is fixed at 1 billion tokens, all circulating already, so there is no future unlock overhang to worry about.
Holder concentration is a mixed picture. The top ten wallets hold under two percent combined, and the largest single holder is a Uniswap liquidity pool rather than a person, which is actually a healthier sign than many new launches show. That kind of distribution matters more than people realize when tracking altcoin market trends across new listings.
HOODIE Technical Price Analysis: What the Chart Is Really Saying
Price action here has been trading inside an ascending channel on the 15-minute chart, a pattern that usually points to steady buyer control rather than a random spike. That structure is the first thing we noticed when we pulled up the chart.
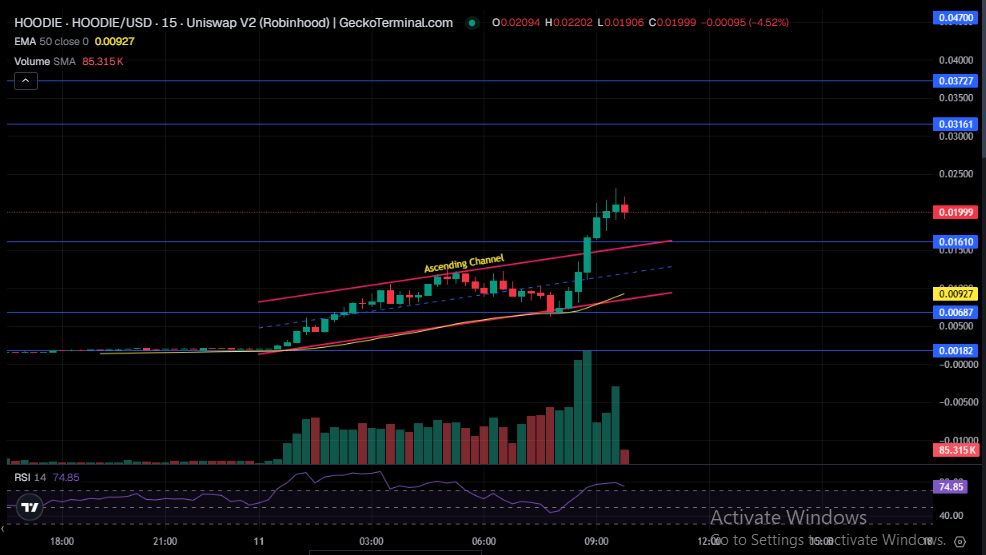
Source: Charting by Gecko Terminal
HOODIE is currently trading well above its 50 EMA, which sits near $0.00927, and that gap alone tells you buyers have been firmly in charge of this trend. RSI at 74.85 is deep into overbought territory, though, and that is not a small detail.
Immediate support sits at $0.0161.
Resistance is layered above at $0.03161 and then $0.03727.
A confirmed breakout above the first resistance, backed by strong volume, could open the path toward the next level. But a rejection here would not be surprising given how stretched the RSI already looks.
HOODIE Short Term Price Prediction for the Coming Days
In the short term, the setup stays bullish as long as the price holds above the $0.0161 support zone.
| Timeframe | Bearish Target | Base Target | Bullish Target | Key Trigger |
|---|---|---|---|---|
| 24 Hours | $0.0161 | $0.0210 | $0.0250 | RSI cooldown or fresh buy volume |
| 3–7 Days | $0.0130 | $0.0225 | $0.0316 | Reaction at first resistance zone |
| 2–4 Weeks | $0.0095 | $0.0250 | $0.0373 | Sustained volume above channel |
Watch the reaction at $0.0316 closely; it decides the next real move.
HOODIE: Long-Term Price Prediction Through 2027
Longer term, the case depends heavily on whether trading activity outlasts the initial hype window.
| Timeframe | Bearish Target | Base Target | Bullish Target | Catalyst Needed |
|---|---|---|---|---|
| 3 Months | $0.0060 | $0.0180 | $0.0400 | Continued Robinhood Chain adoption |
| 6 Months | $0.0040 | $0.0220 | $0.0550 | New exchange listings |
| End of Year | $0.0030 | $0.0250 | $0.0700 | Sustained holder growth |
| 2027 Outlook | $0.0020 | $0.0300 | $0.0900 | Broader memecoin cycle strength |
Honestly, the long-term case here is speculative. It leans on continued attention more than any fixed utility.
HOODIE Price Scenarios: Worst Case, Base Case and Best Case
Worst Case: RSI cools sharply, early buyers take profit, and price breaks below $0.0161 support, triggering a fast slide toward the invalidation zone.
Base Case: Price consolidates between $0.0161 and $0.0316 for one to two weeks while volume decides the next direction.
Best Case: Volume stays strong, resistance at $0.0316 breaks with conviction, and price pushes toward $0.0373 and beyond on renewed buying.
| Scenario | Price Range | What Triggers It |
|---|---|---|
| Worst Case | $0.006 - $0.012 | Breakdown below support with increased profit-taking. |
| Base Case | $0.016 - $0.025 | Sideways consolidation with mixed trading volume. |
| Best Case | $0.031 - $0.045 | Resistance breakout supported by a fresh surge in trading volume. |
Key HOODIE Price Levels Every Trader Should Watch
Resistance zone: $0.03161, then $0.03727 above that. A close above both on strong volume would confirm continuation.
Support zone: $0.0161. This is the level buyers have defended so far during this rally.
Invalidation zone: Below $0.00687. A close under this level would break the current bullish structure entirely.
HOODIE Analyst View and Final Thoughts on This Rally
The chart setup right now still favors buyers, and the ascending channel backs that up. But an RSI near 75 is not something to ignore; it usually means a cooldown is coming before any real continuation.
A weekly close above $0.0161 would confirm buyers are still defending their ground here. Below it, the story changes fast.
One thing worth tracking beyond the chart is overall market sentiment. Checking the Fear and Greed Index alongside this setup gives useful context, since memecoins tend to move harder in either direction when broader sentiment is extreme.
The most important level to watch remains $0.0161. Hold it, and the bullish case stays alive. Lose it, and this turns into a very different chart. It also helps to keep an eye on theBitcoin price outlook , since memecoins rarely move in total isolation from the majors.
Fast money made this move. Slower money will decide what happens next.
Disclaimer: This article is for educational purposes only and does not constitute financial advice. Crypto markets are volatile. Consult your investment advisor before making any investment decision.
Also read:

















