Hyperliquid Price Prediction: U-Shape Recovery Possible?


HYPE is trading around $67.97 right now, up over 1% on the day.
This Hyperliquid price prediction looks at how this round bottom reversal has carried price right back into the flip zone, along with fresh data on HYPE spot ETF inflows that adds another layer to the setup.
Together, the chart structure and this inflow trend help frame where HYPE could head next.
As Per Coinglass: Hyperliquid Price Right Now
Metric | Value |
Current Price | $67.97 |
Market Cap | $17.21B |
Futures Volume (24H) | $2.26B |
Spot Volume (24H) | $167.97M |
Open Interest | $2.86B |
Circulating Supply | 252.97M HYPE |
Total Supply | 953.28M HYPE |
Max Supply | 953.28M HYPE |
According to Wu Blockchain on X, staff from the SEC Crypto Task Force met with representatives from the Hyperliquid Policy Center, XYZ Ltd., and Sullivan and Cromwell on July 14 to talk through crypto asset regulation.
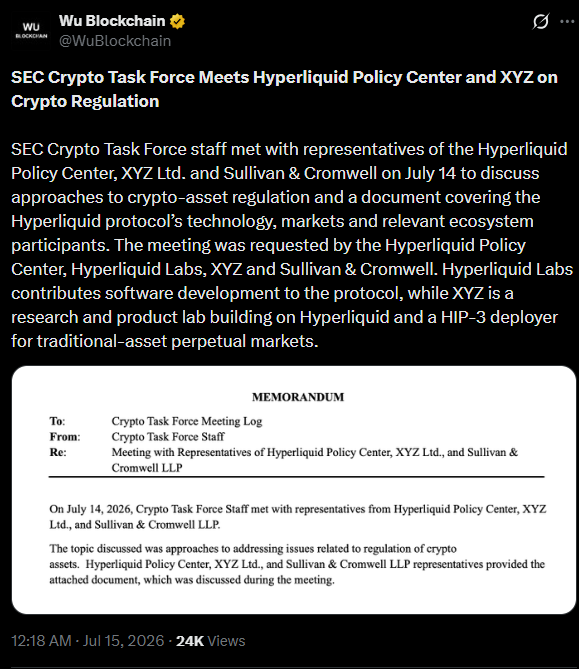
The discussion covered a document outlining Hyperliquid's technology, markets, and the wider ecosystem around it.
Hyperliquid Labs handles software development for the protocol, while XYZ works as a research and product lab building on Hyperliquid and also serves as a HIP-3 deployer for traditional asset perpetual markets.
For any Hyperliquid price prediction, direct engagement with US regulators is a notable step toward long-term legitimacy.
Hyperliquid ETF data
According to the latest HYPE spot ETF data, cumulative net inflows have now reached $304.67 million, with total net assets sitting at $336.20 million.
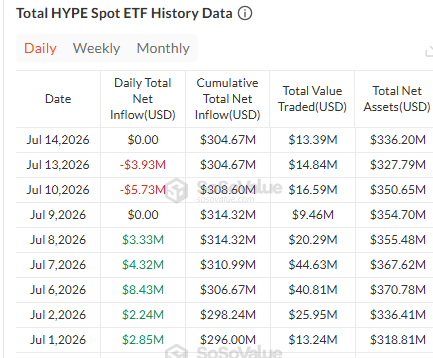
The daily flow has been a bit choppy lately, though, with a flat day on July 14, a $3.93 million outflow on July 13, and a $5.73 million outflow on July 10, following a stronger stretch earlier in the month that included inflow days of $8.43 million and $4.32 million.
For any Hyperliquid price prediction, this kind of pattern shows that while overall investor interest remains solidly positive, the pace of fresh money coming in has slowed down over the past week.
Hyperliquid Liquidation Overview
As per CoinGlass liquidation data, short positions are getting hit the hardest across every single timeframe, from the 1-hour window all the way out to 24 hours.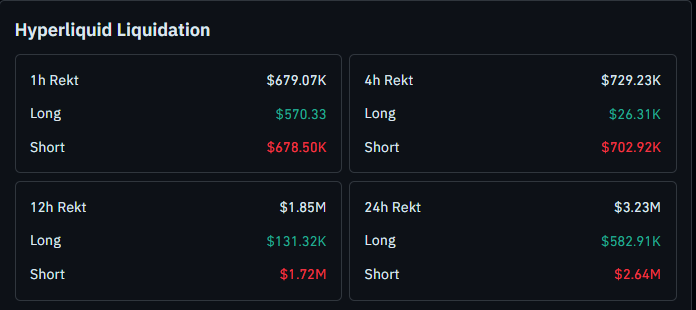
Source: Liquidation data by CoinGlass
This heavy short-side liquidation lines up closely with the strong bounce HYPE has put in, showing that sellers have been caught offside repeatedly as price keeps grinding back up toward the flip zone.
Hyperliquid Technical Analysis: U-Shape Recovery Builds Bullish Momentum
On the 1-hour chart, HYPE has formed a textbook round bottom, or U-shape, reversal pattern.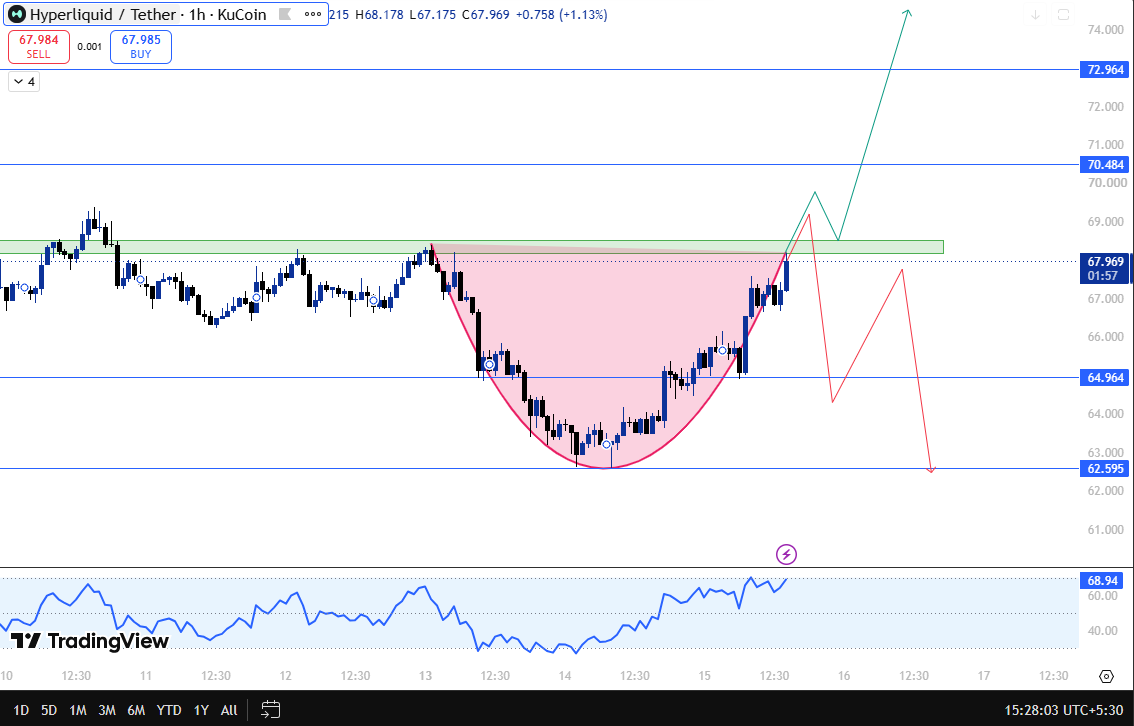
Price rolled over from the flip zone, drifted down gradually, and then curved smoothly through a rounded base rather than dropping sharply, which usually signals that selling pressure faded out slowly instead of all at once.
From the bottom of that curve, HYPE has been climbing back up in the same gentle, rounded manner, and this steady grind higher has now brought price right back to test the same flip zone it broke down from earlier.
This kind of slow, rounded recovery is often seen as a healthier structure than a sharp v-shaped bounce, since it suggests buyers have been stepping in gradually rather than chasing a quick spike.
RSI on the hourly chart is also climbing higher along with this move, adding some extra weight behind the recovery.
If HYPE manages to close above this flip zone with strength, the next target comes in at $70.484, and beyond that, $72.964 opens up as the next level to watch.
On the other hand, if price gets rejected from this zone again and starts sliding lower, the next support sits at $64.964, and if that fails to hold as well, the next support after that comes in near $62.595.
Hyperliquid Support and Resistance Levels
Level Type | Price |
Resistance | $72.964 |
Resistance | $70.484 |
Flip Zone / Breakout Trigger | $68.20-68.50 |
Support | $64.964 |
Support | $62.595 |
Risk and Reward: The Honest Version
Factor | Bull Case | Bear Case |
Flip Zone Breakout | Closes above with strength, opens path to $70.484 and $72.964 | Rejects again, price slides back toward $64.964 |
$64.96 Support | Holds and keeps the round-bottom recovery structure alive | Breaks down; next support opens at $62.595 |
The analysis above combines short-term chart structure with the latest Hyperliquid ETF inflow data and should not be treated as a guarantee of future performance.
Invalidation Level
This round bottom recovery structure stays valid as long as HYPE holds above $64.964.
A confirmed break and close below this level would invalidate the current bullish attempt, and in that case HYPE would likely slide toward the $62.595 support zone before any fresh recovery attempt becomes realistic.
Expert View
Traders watching HYPE on the lower timeframe are treating this smooth U-shape recovery as a healthier setup than a sharp bounce, since a rounded base often points to buyers accumulating gradually rather than chasing price.
With short positions taking the bulk of the damage across every liquidation window, the current move looks like it is catching sellers off guard rather than the other way around.
Most agree that a clean close above the flip zone would confirm this Hyperliquid price prediction's bullish case, opening the door toward $70.484 and $72.964, while a rejection here keeps $64.964 and $62.595 in focus as the levels to watch on the downside.
The slowing pace of ETF inflows this past week is also something worth keeping an eye on alongside the chart.
Disclaimer: This article is for informational purposes only and should not be considered financial advice. Cryptocurrency markets are highly volatile, and price predictions are not guaranteed. Please do your own research before making any investment decisions.
















