BONK Price Prediction: One Breakout Could Change Everything


BONK's chart is quietly setting up something worth watching.
A rare wave pattern is forming on the shorter timeframe, right while the bigger picture is still stuck in a downtrend.
This BONK price prediction walks through both stories and where price could head next.
Current BONK Price and Market Overview Right Now
$BONK sitting Currently at $0.00000374 right now, down close to 1.65% on the day. Not a huge move, but it adds to the grind.
Market cap comes in at $331,211,689.07, backed by a supply so large it's almost funny to type out: roughly 88 trillion tokens in circulation.
Trading volume over the last 24 hours dropped to $816,095.3, off 26.38% from before.
That's a real pullback in activity, worth noting. On the holder side, over a million wallets 1,002,618 to be exact, are currently holding BONK.
For a token this size, that's a genuinely large base.
BONK Liquidation Data: Shorts Are Taking the Pain
The liquidation heatmap is leaning one way right now.
In both the 1-hour and 4-hour windows, total liquidations sit at $424.68, and every dollar of it came from shorts; longs show $0 in both windows. 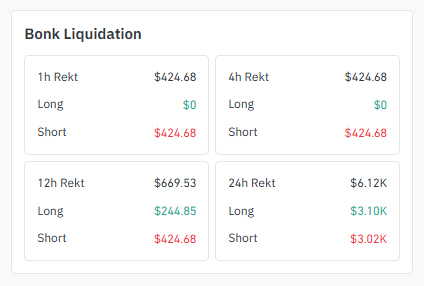
Source: Liquidation Data Taken From Coinglass
That's a clean short, and that short position got caught off guard during the recent bounce.
Zoom out to 12 hours, and it's $669.53 total; split $244.85 long against $424.68 short, shorts are still taking the bigger hit.
The 24-hour number is $6.12K total, more balanced this time at $3.10K long versus $3.02K short.
So the pressure on shorts has been strongest in the most recent hours, which fits the story of BONK climbing back off support against that falling trendline.
Exchange Volume Heatmap: Where the Futures Action Is
Gate leads $BONK exchange volume at $5.38M, with OKX close behind at $4.88M.
Bitunix follows at $1.83M, then LBank at $1.15M, with WhiteBIT, CoinEx ($331.30K), Kraken, and a couple of smaller venues making up the rest. 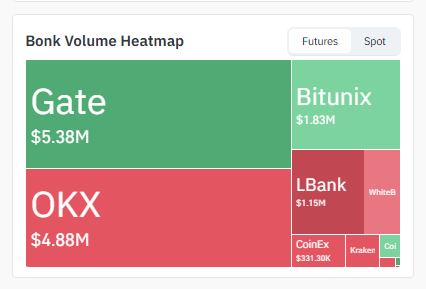
Source: Heatmap Data Taken From Coinglass
Volume here is fairly concentrated on the top two exchanges, which usually means bigger players are the ones actively pushing this move rather than scattered retail activity.
Holder Data Check: How Concentrated Is BONK Really
BONK's holder base tells its own story. The top 10 wallets alone control 38.51% of supply, worth about $122.66M.
Zoom out further and whale concentration hits 68.04%, worth $216.71M just 49 wallets classified as "whales" hold that entire chunk, which works out to roughly 0.004905% of all holders controlling more than two-thirds of the value.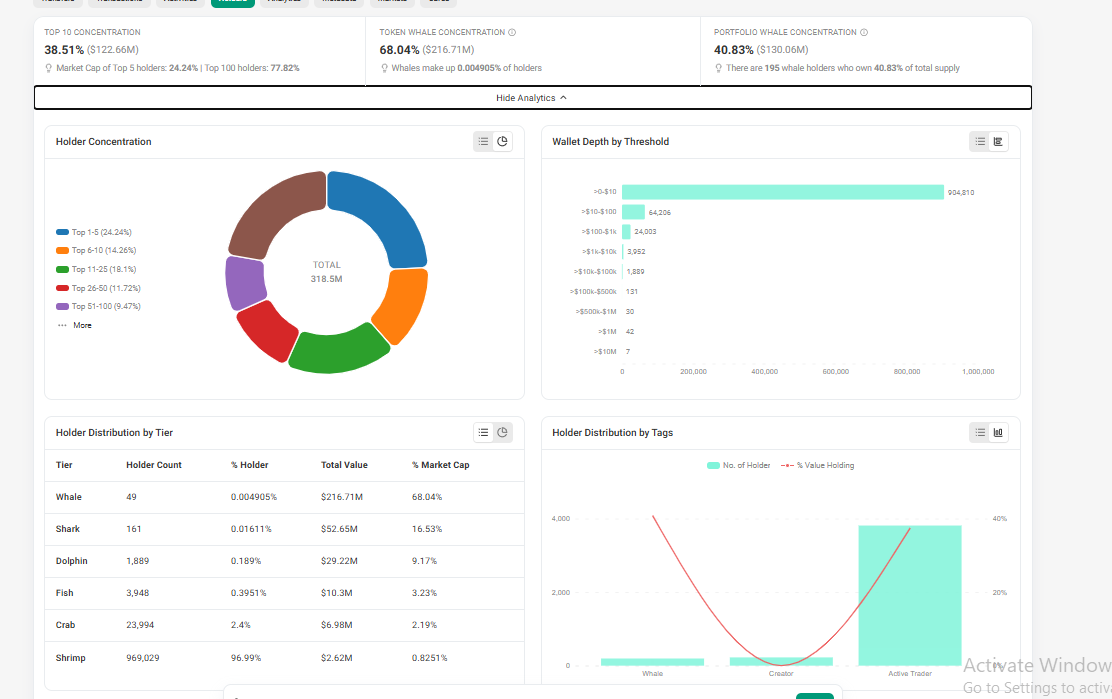
The rest of the base breaks down like this: Shark-tier wallets (161 of them) hold 16.53%, and dolphins (1,889 wallets) hold 9.17%, fish (3,948 wallets) Hold 3.23%, crabs (23,994 wallets) hold 2.19%, and shrimp, the smallest holders, numbering 969,029 wallets, hold just 0.8251% between all of them.
That's a heavily top-loaded structure. It's not unusual for a meme token this size, but it does mean a small number of wallets have outsized power over where price goes if they decide to move
4H Chart: Falling Trendline and a Wolfe Wave Setup
Here's where it gets more interesting.
On the 4-hour chart, $BONK has formed what looks like a wolfe wave pattern a series of swings that squeeze into a falling trendline before usually snapping hard in one direction. 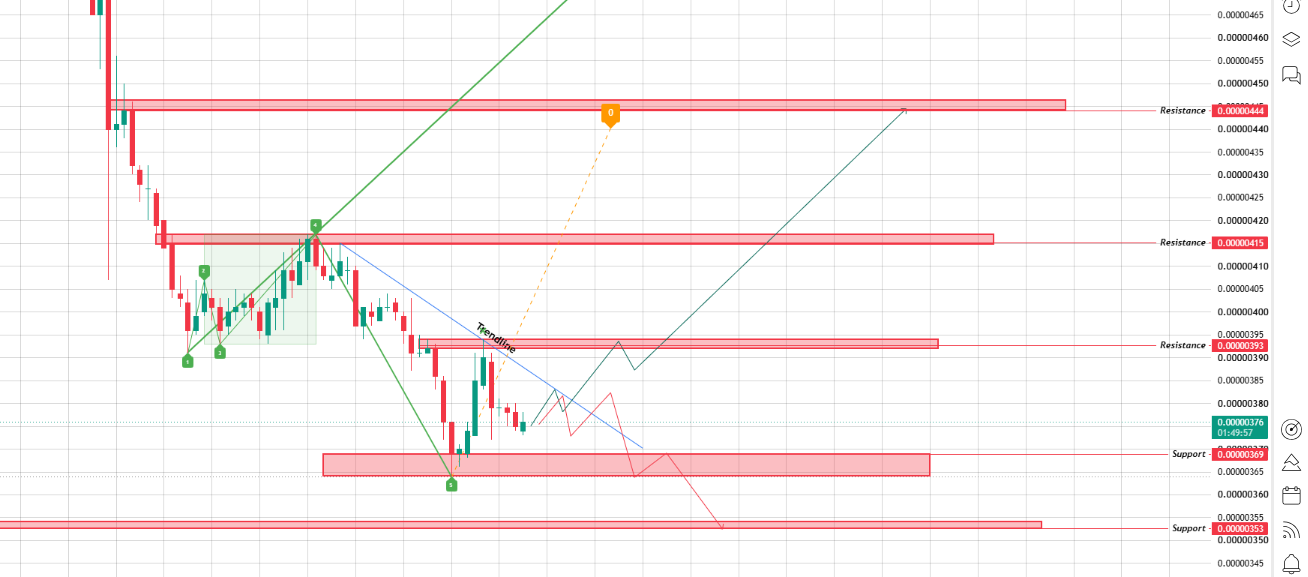
Source: Chart Taken From TradingView
Price bounced off support near $0.00000369 and has been climbing back up against that falling trendline, now trading around $0.00000376.
A Wolfe Wave like this usually points toward one thing: once the falling trendline breaks, price tends to rush toward the pattern's target line.
Here, that lines up with the $0.00000393 resistance level first, then $0.00000415, and finally the bigger target near $0.00000444 if the move really carries.
If the trendline holds instead and the price gets rejected, a dip back toward the $0.00000369–$0.00000353 support zone is the more likely path.
The setup is leaning bullish, but it still needs that trendline break to confirm it.
1D Chart: BONK Still Stuck Inside a Descending Channel
On the daily chart, BONK is boxed inside a descending channel, with both the upper and lower lines sloping down together.
Price is currently trading near $0.00000374, close to the lower part of that channel.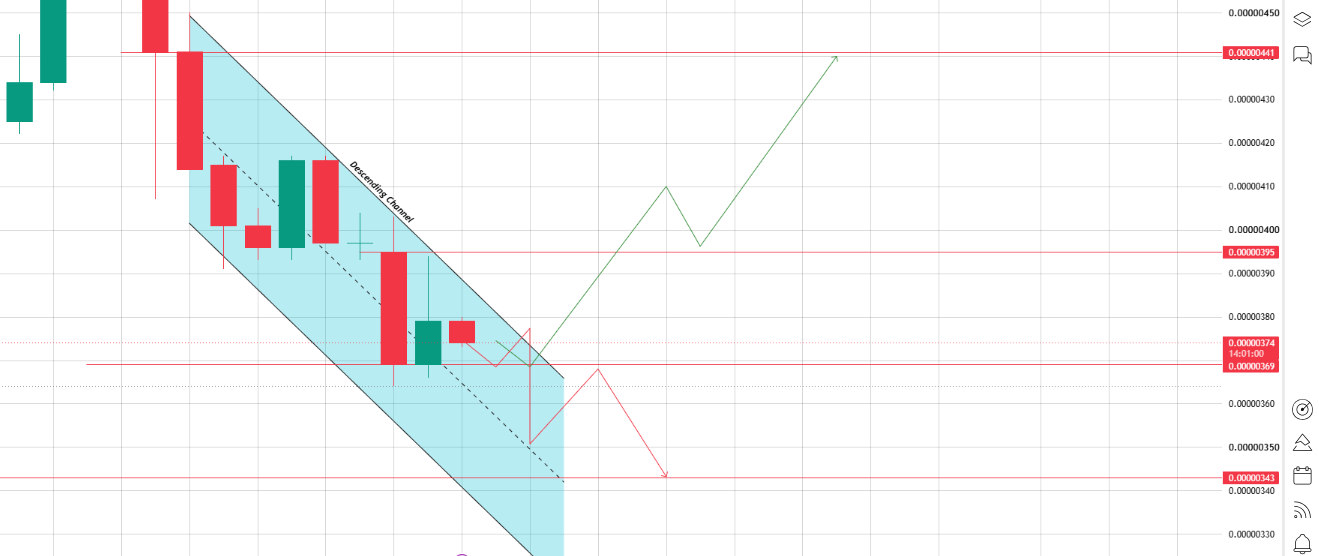
Source: Chart Taken From TradingView
If the price breaks above the channel, $0.00000395 is the first target.
Clear that too, and $0.00000441 comes next; that would be a real shift in trend direction.
But if the channel holds and sellers stay in control, $0.00000343 becomes the next level down.
The daily chart hasn't broken free of this channel yet, so it's still the bigger downtrend calling the shots for now.
BONK Three-Scenario Price Outlook: Bull, Bear, Neutral
A simple table covering the bullish breakout case and the bearish breakdown risk together:
| Scenario | Trigger | Price Target |
|---|---|---|
| Bullish Breakout | Falling trendline breaks and the channel clears $0.00000395–$0.00000415. | $0.00000441–$0.00000444 |
| Neutral / Range-bound | Price stays stuck between $0.00000369–$0.00000393. | $0.00000374–$0.00000393 |
| Bearish Breakdown | Trendline rejection and the channel breaks down through $0.00000369. | $0.00000343 |
Final Outlook: What Could Push BONK Past Resistance
Put it together and BONK is caught between two different stories.
The daily chart is still stuck inside a falling channel, but the 4-hour chart is showing early signs of a Wolfe Wave setup that leans bullish once that falling trendline gives way.
Shorts have already been getting squeezed on the recent bounce, and volume is concentrated enough on major exchanges to suggest real positioning is happening, not just noise.
The wider market will likely be the deciding factor here.
$BONK tends to move harder when BTC dominance eases and capital rotates into smaller altcoins; a steady or rising Bitcoin gives this Wolfe Wave setup more room to actually play out.
There's also an ETH correlation worth keeping an eye on, since altcoin risk appetite often tracks Ethereum's strength closely too.
If BTC and ETH hold firm while BONK clears $0.00000393 and then $0.00000415, a run toward $0.00000441 starts looking like a realistic price target rather than just wishful thinking.
















