Injective Price Prediction: INJ Turns Bullish Above $4.47


Something shifted on the INJ chart in the last session, and traders who have been watching this pair patiently are starting to pay closer attention again.
A zone that acted as resistance for weeks just got reclaimed, and the way price responded afterward has changed the tone of the setup entirely.
This injective price prediction looks at exactly what happened, why it matters, and what needs to hold for the move to actually continue.
The levels discussed below come from the 1-hour INJ/USDT perpetual chart on Binance and reflect short-term intraday structure.
If the price closes meaningfully outside the range discussed here, these levels should be rechecked before being used again.
Injective Price Right Now
Metric | Value |
Current Price (CMP) | $4.589 |
24h Change | +3.64% (+$0.1612) |
24h Futures Volume | $114.48M |
24h Spot Volume | $28.53M |
Market Cap | $457.11M |
Open Interest | $89.84M |
Circulating Supply | 99.97M INJ |
Total Supply | 100.00M INJ |
An open interest of $89.84M represents the total value of futures contracts on Injective that are still open, and a figure this size relative to spot volume shows leveraged traders are actively positioned around the current range, which is part of why the recent move carried extra weight.
Chart source: TradingView, INJ/USDT Perpetual, Binance, 1-hour timeframe, captured 12 August 2026, 09:40 IST (04:10 UTC). Market data source: CoinGlass, same timestamp.
How This Injective Price Prediction Was Calculated
Every level in this breakdown comes directly from the chart structure and data supplied for this session, not from an automated indicator scan.
The flip zone, trendline, and target levels referenced below were drawn from live price action on the 1-hour Injective/USDT chart and cross-checked against the current market snapshot above.
No RSI, MACD, or higher-timeframe readings are included here since none were supplied for this session, though a general explanation of these tools appears in the glossary further down.
Injective Just Joined a Major Cross-Chain Routing Network
Fresh off-chart context also supports the bullish tone here.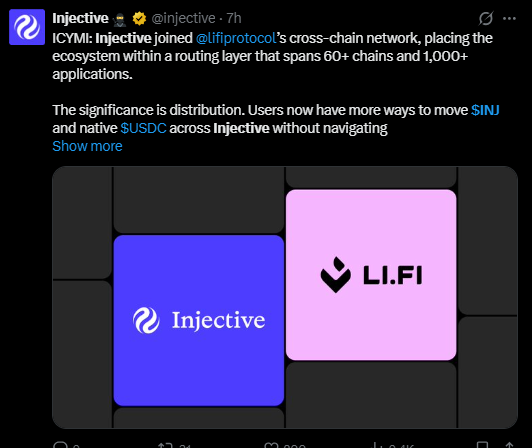
Injective recently confirmed its integration with LI.FI's cross-chain network, placing it inside a routing layer connecting over 60 chains and more than 1,000 applications.
In practice, this means INJ and native USDC can now move across Injective without users needing to hop through separate bridging tools, which lowers friction for capital entering the ecosystem.
This kind of distribution upgrade is one reason some traders view the current INJ breakout analysis as more than just a technical bounce.
Source: Injective (@injective on X), referenced within the past 24 hours.
Liquidation Snapshot
Liquidation flow over the past day leans in favor of the bulls.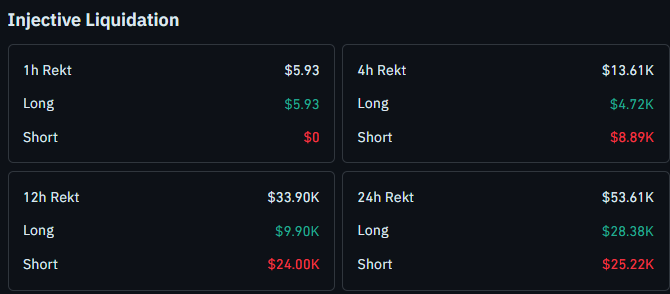
In the last hour, only $5.93 in longs got liquidated with zero short liquidations, showing the move up wasn't purely a short squeeze.
Over 4 hours, $13.61K total was wiped out, split between $4.72K in longs and $8.89K in shorts.
The 12-hour window tells a clearer story: $33.90K total rekt, with shorts taking the bigger hit at $24.00K against $9.90K in longs.
Zooming out to 24 hours, $53.61K was liquidated in total, $28.38K in longs, and $25.22K in shorts, a more balanced picture that suggests the market is still working out direction rather than fully committing either way.
Source: CoinGlass, Injective liquidation data, captured 12 August 2026.
Key Takeaways
INJ reclaimed its $4.462-$4.476 flip zone, and the structure has shifted bullish
Price is currently trading at $4.589, up 3.64% in the past 24 hours
A trendline-supported move opens the door toward $4.756 and $5.157
A volume-backed close back below the flip zone would put $4.361 in play
Short liquidations are outpacing longs across the 4h, 12h, and 24h windows
A quick risk note before going further: leveraged positions around a freshly reclaimed zone like this one carry real liquidity risk, and false breakouts are common right after a level flips from resistance to support. Treat every level below as a decision point, not a guarantee.
What Does the INJ Chart Actually Show Right Now?
INJ recently broke out of its $4.462-$4.476 flip zone, and the structure on the chart has shifted from range-bound to bullish following that move.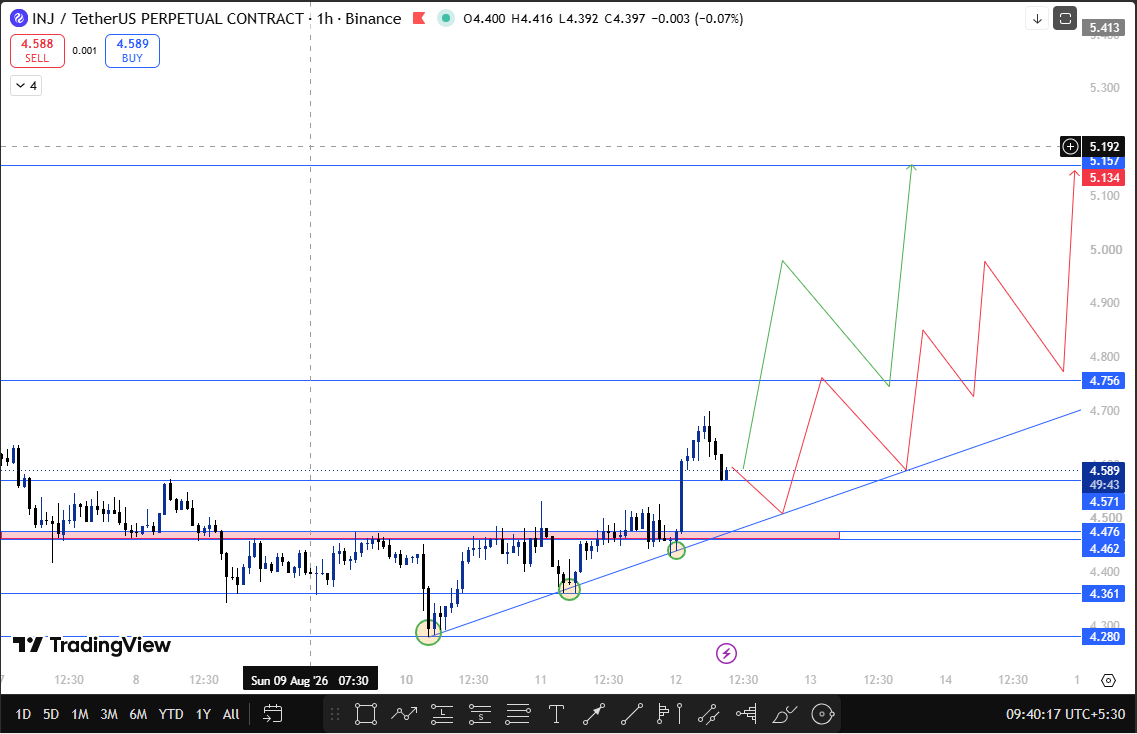
Price has been riding an ascending trendline off the recent swing low, and that trendline is now acting as dynamic support underneath the current range.
As long as price continues to respect it, the path of least resistance points toward the next resistance band.
If the trendline continues holding, the next major resistance sits at $4.756, with a further target at $5.157 if that first level gives way.
Both levels sit above the current $4.589 price, so this remains an unconfirmed, developing setup rather than a locked-in trend.
The other side of this injective rally prediction depends entirely on whether the flip zone holds.
If the price closes back below $4.462-$4.476 on a volume-backed candle, the breakout would be considered failed, and the next support to watch drops to $4.361.
Technical Outlook Snapshot
Signal | Reading |
Structure | Bullish shift confirmed after flip zone breakout |
Trendline | Ascending, currently providing dynamic support |
Flip Zone | $4.462-$4.476, reclaimed, must hold to stay valid |
Breakout Status | Confirmed above flip zone, unconfirmed above $4.756 |
Injective Support and Resistance Levels to Watch
Type | Level | Note | % From CMP |
Reclaimed flip zone | $4.462 - $4.476 | Former resistance, now the key support base | -2.8% to -2.5% |
Immediate resistance | $4.756 | First major hurdle if the trendline holds | +3.6% |
Major resistance | $5.157 | Next target beyond $4.756 | +12.4% |
Breakdown support | $4.361 | Only relevant if the flip zone fails | -5.0% |
This kind of setup is similar to what played out in a recent INJ reversal setup, where a reclaimed zone acted as the pivot for the next leg.
Risk-Reward Table
Case | Trigger | Target |
Bull Case | Trendline support holds, and the flip zone stays reclaimed. | $4.756, then $5.157 |
Bear Case | Volume-backed close below $4.462-$4.476 | $4.361 |
What Would Change This Injective Price Prediction?
Two things would force a rework of this view. A confirmed close above $4.756 on strong volume would validate the bullish case and shift focus toward $5.157 next.
On the other side, a volume-backed close beneath the $4.462-$4.476 flip zone would invalidate the breakout entirely and put $4.361 back in focus.
Until one of those happens, this setup stays in a confirmation-pending state, similar to what was outlined in a recent triangle breakout structure on this same pair.
How Bitcoin Sentiment Could Move Injective
Injective doesn't trade in isolation, and broader market sentiment still plays a role here.
If Bitcoin holds its own structure and risk appetite stays intact, altcoins with fresh bullish setups like this one tend to get more follow-through on breakouts.
A sudden risk-off move in Bitcoin, on the other hand, could pressure INJ's flip zone even if the local structure looks fine on its own, a dynamic covered in more depth in a related INJ coin price prediction breakdown.
When This Injective Price Prediction Gets Revisited
This setup will be revisited if the price closes decisively beyond either boundary discussed above, specifically above $4.756 or below the $4.462-$4.476 flip zone, or if no confirmation happens within the next 24 hours of trading.
Fresh liquidation and open interest data will also be checked against any move before updating the levels here.
Traders watching listings and structural catalysts may also want to check a related INJ price prediction today piece covering a similar wedge-and-listing scenario.
Glossary
Flip Zone: A price range that previously acted as resistance and, once reclaimed, starts acting as support instead.
Open Interest: The total value of outstanding futures contracts that haven't been closed or settled.
Trendline Support: A rising diagonal line connecting higher lows, used to judge whether an uptrend is intact.
Liquidation: The forced closing of a leveraged position when losses exceed available margin.
Breakout: A move where price closes decisively beyond a previously established range or level.
Bull, Base, and Bear Case
Bull Case: The trendline holds as support, the flip zone stays reclaimed, and price pushes toward $4.756 before attempting $5.157.
Base Case: INJ consolidates around the current range while the market waits for a clean close in either direction, with the flip zone acting as the line in the sand.
Bear Case: A volume-backed close below $4.462-$4.476 fails the breakout and sends the price back toward $4.361.
Disclaimer
This content is for informational purposes only and does not constitute financial, investment, or trading advice. Cryptocurrency markets are highly volatile, and leveraged positions carry substantial risk of loss. Always do your own research before making any trading decisions. CoinGabbar and the analyst do not hold a position in INJ at the time of publication.

















