Injective Price Prediction August 2026: Can INJ Break Its Triangle?

A Layer 1 that most traders had written off just landed two institutional headlines in one week, and the chart is finally starting to agree with the news. Is this the move that finally clears INJ's year-long ceiling or another false start inside a pattern that keeps trapping buyers?
Injective Price Prediction: Why a Quiet L1 Is Suddenly Loud Again
This Injective price prediction August 2026 matters because $INJ just did something it has not done in weeks: it moved on real news instead of pure chart noise.
For months INJ sat inside a shrinking range, the kind of setup that stops showing up in most people's watchlists.
Then two institutional stories landed almost back to back.
A Korean trade finance pilot on one side and a native stablecoin rail on the other. And now the chart is testing the exact resistance that's rejected it before.
Is the fundamentals story finally strong enough to force a real breakout? Let's look at what the charts, the wallets, and the order books actually say.
Key Takeaways
-
Injective (INJ) trades near $4.822 on the daily chart, up 4.71% intraday, after touching an intraday high of $4.836; on CoinMarketCap the 24H change reads closer to 4.51%-4.55% depending on snapshot time.
-
Daily RSI sits at a neutral 46.30; weekly RSI reads 48.53. Neither timeframe is overbought, which separates this Injective price prediction August 2026 from a typical squeeze-driven pop.
-
INJ is coiling inside a daily symmetrical triangle that's been compressing since May, while the weekly chart is testing the top trendline of a descending channel dating back to late 2024.
-
Circulating supply sits at 99.97M of a 100M total supply, per CoinMarketCap, so unlocked market cap ($480.85M) and FDV ($480.87M) are nearly identical. There's essentially no token-unlock overhang here.
-
On Injective's own explorer, 56,745,045 INJ is staked at a 7.01% APR, and 7,189,186 INJ has been burned cumulatively, out of 1,680,338 total wallets.
-
24-hour futures liquidations hit $109.51K, split $73.55K short and $35.96K long, a squeeze pattern, not a leverage blow-off like some altcoins are seeing this week.
-
The catalysts behind this move: a POSCO International and LG CNS trade finance pilot, native USDC rails going live on Kraken, a completed mainnet upgrade, and an August community buyback set to burn over 33,000 INJ.
Table of Contents
-
Injective Price Today: Live Data and 24-Hour Change
-
Why INJ Is Moving This Week
-
Technical Analysis: Daily Triangle vs Weekly Channel
-
INJ Support and Resistance Levels
-
On-Chain and Tokenomics: Staking, Burns, Supply
-
Where INJ Is Actually Trading
-
Injective Price Prediction August 2026: Bull, Base, Bear
-
Will INJ Reach $10? Can It Reach $50?
-
Long-Term Outlook: 2027 to 2030
-
Risks That Could Invalidate This Forecast
-
Glossary
-
Methodology
Injective Price Today: Live Data and 24-Hour Change
Here's the thing: the daily chart on OKX's INJ/USDT pair opened today at $4.616, ran to a high of $4.836, and last traded at $4.822, up 4.71% on the session, captured at 12:21 UTC on the TradingView chart.
CoinMarketCap's snapshot shows a slightly different read, $4.80, and a 24H change closer to 4.51%-4.55%, a market cap of $480.72M, and a 24H volume of $74.19M, up 14.46% on the day.
That gap between sources is normal. Different exchanges, different candle closes. We're using the TradingView OKX close as the primary figure throughout this piece.
Daily RSI sits at 46.30. Weekly RSI reads 48.53. Neutral on both counts.
Immediate resistance sits at the $5.427-$5.504 zone. Immediate support sits near $4.261. Nothing is stretched here.
Why INJ Is Moving This Week
Two separate stories are stacking on top of each other, and neither one is a rumor.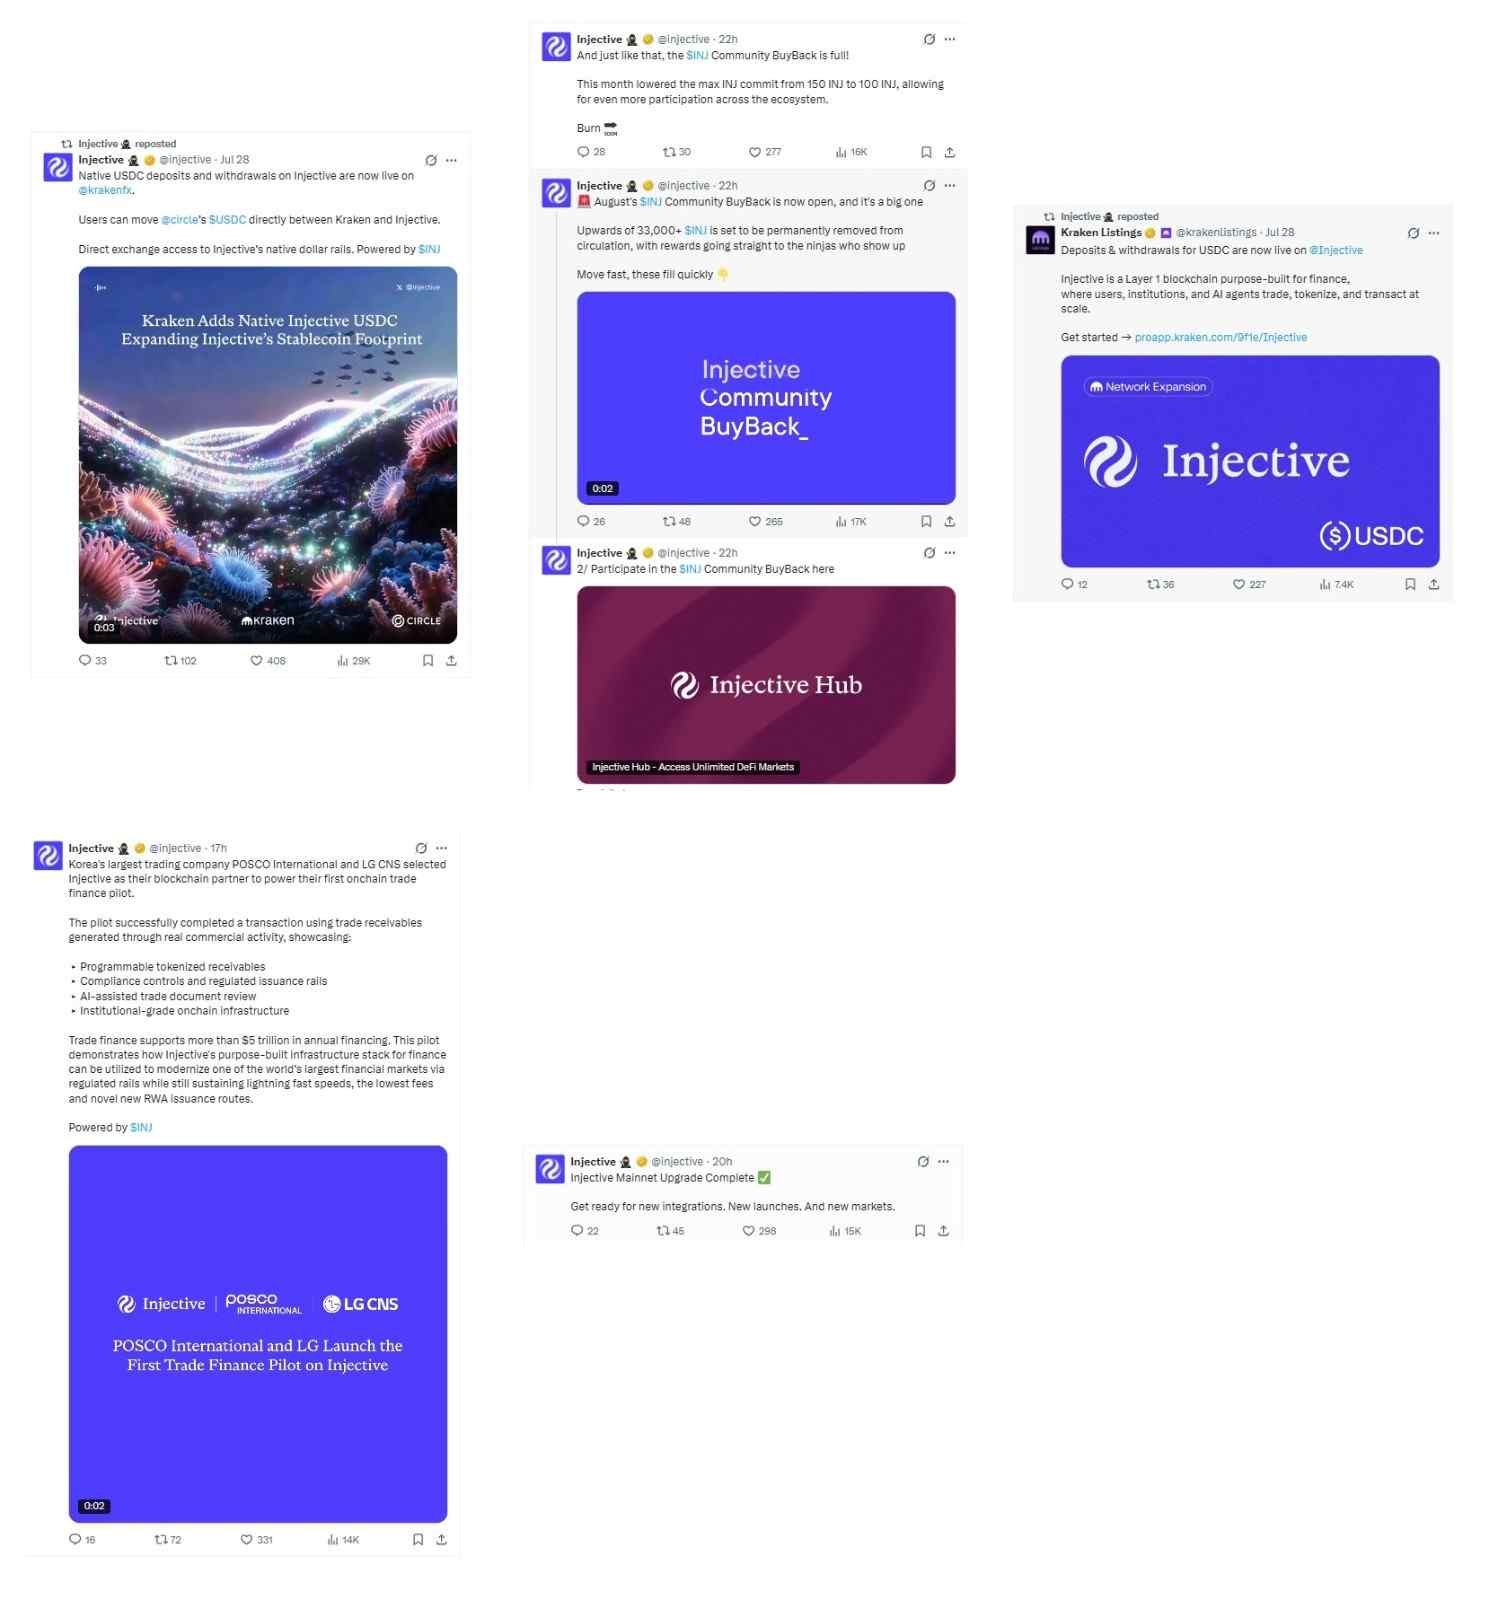
The first: Korea's largest trading company, POSCO International, along with LG CNS, selected Injective as their blockchain partner for a first on-chain trade finance pilot. The pilot completed a transaction using tokenized trade receivables generated from real commercial activity, with compliance controls and AI-assisted document review built in. Trade finance is a market that supports more than $5 trillion in annual financing globally.
The second: native USDC deposits and withdrawals went live on Kraken, giving direct exchange access to Injective's own dollar settlement rails. Kraken's own account confirmed the same rollout.
On top of both, Injective completed a mainnet upgrade roughly 20 hours ago, and the team is teasing "new integrations, new launches, and new markets" as a result.
But there's a mechanical layer here too.
August's $INJ community buyback just opened, and it's described as the biggest one yet, with upwards of 33,000 INJ set to be permanently burned. This month's buyback also lowered the max INJ commit from 150 to 100, letting more wallets take part.
None of this is leverage doing the talking. This is fundamentals catching up to price.
Technical Analysis: Daily Triangle vs Weekly Channel
This is the core of any real injective price analysis right now, and the two timeframes are telling a related but distinct story.
Daily Chart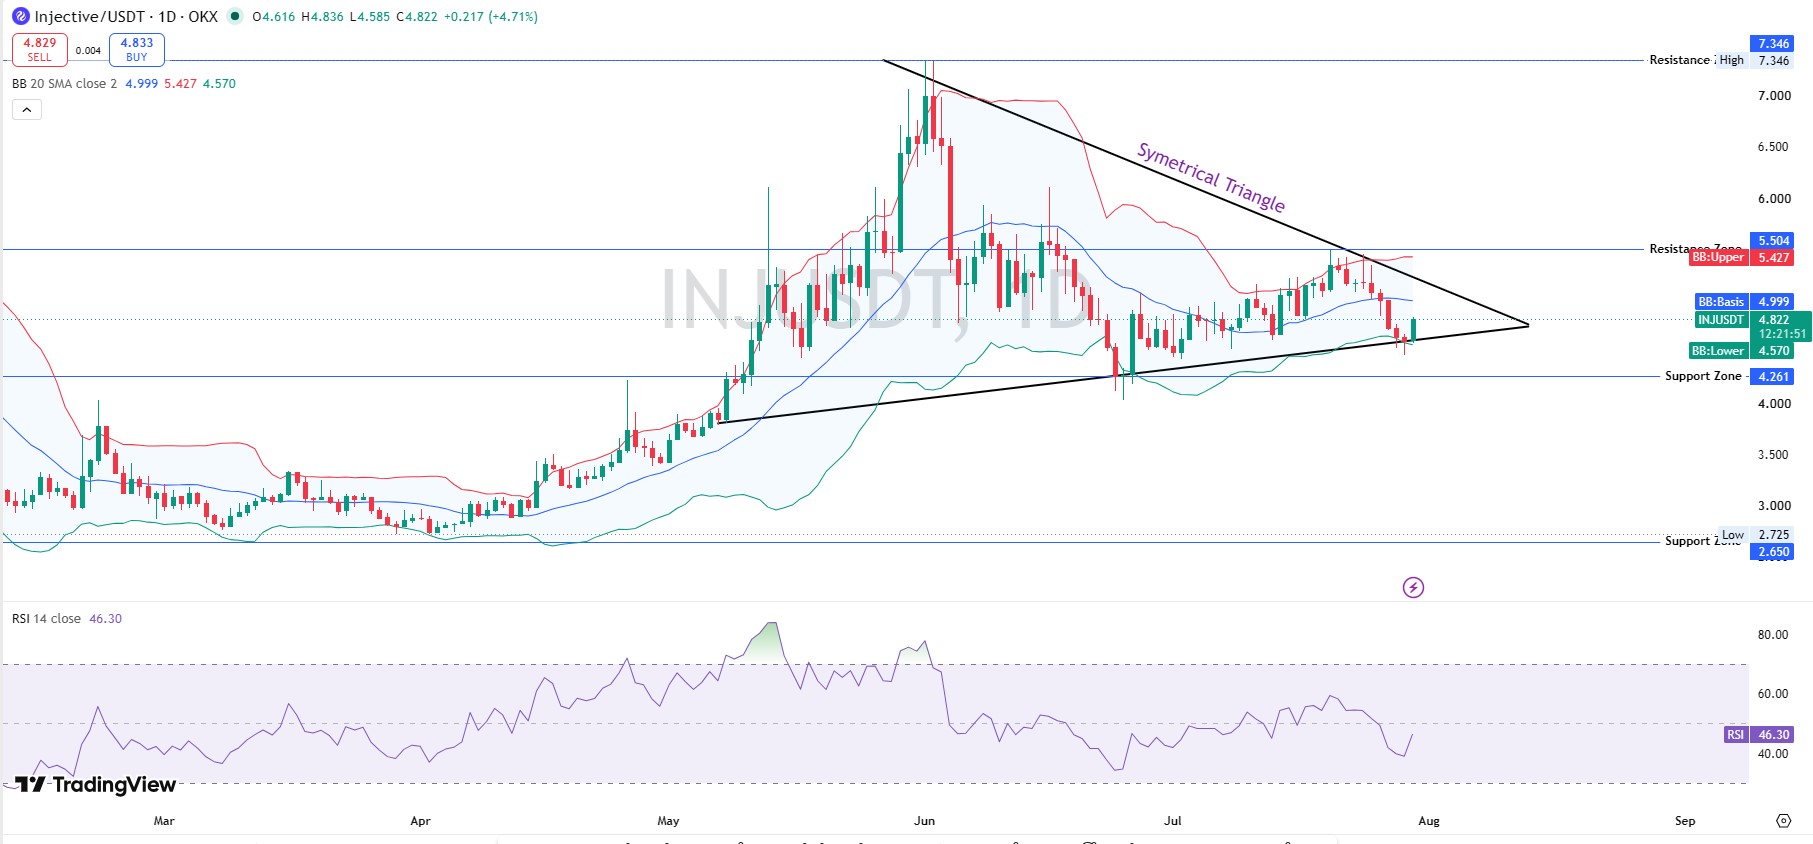
On the daily chart, INJ has been carving a symmetrical triangle since early May, with lower highs falling from the June peak near $7 and higher lows rising off the $3.9 zone. Price is currently sitting right around the 20 SMA basis at $4.999, inside Bollinger Bands with an upper band of $5.427 and a lower band of $4.570.
That triangle is still unresolved. A close above $5.427 with volume would be the cleanest daily breakout signal on the chart right now.
Weekly Chart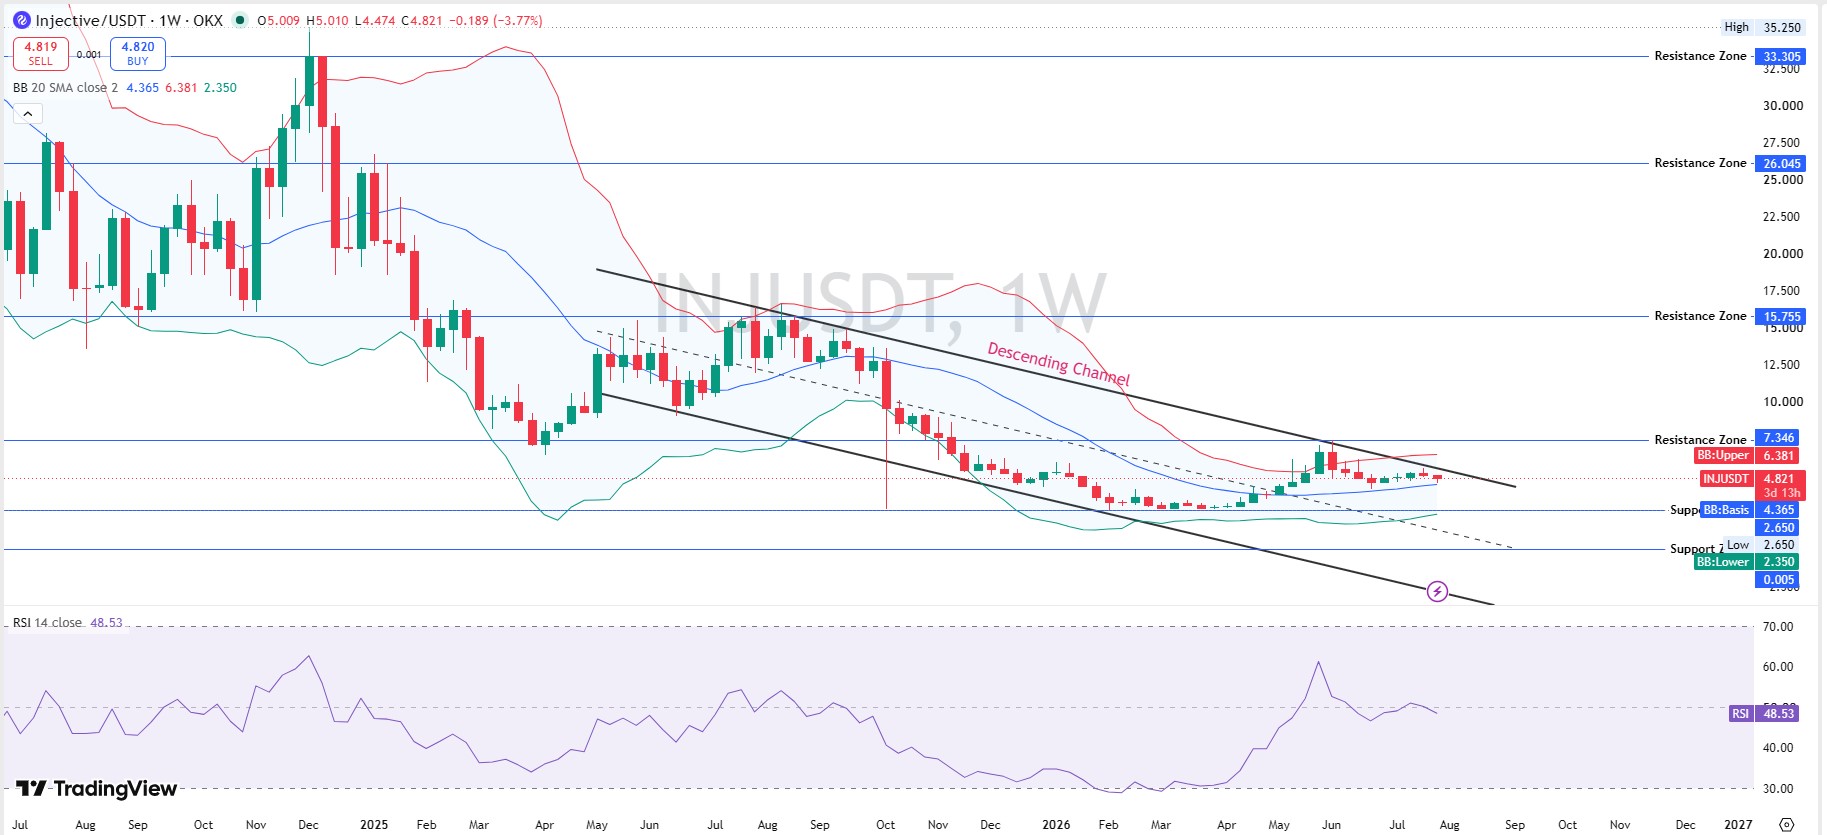
Zoom out and the picture gets more interesting. $INJ has been stuck in a descending channel since late 2024, and this week's candle is testing the upper trendline of that channel directly.
Weekly close sits at $4.821, down 3.77% for the week even with today's 4.71% daily gain since the week opened higher near $5.009. Weekly Bollinger Bands show a basis of $4.365, an upper band of $6.381, and a lower band of $2.350.
A weekly close above that channel trendline, roughly in the $5.5-$6.4 zone, would be the strongest signal in this entire Injective price prediction for August 2026.
We pulled up both timeframes side by side, and the tension is obvious: daily momentum wants to break out; weekly structure hasn't confirmed it yet.
INJ Support and Resistance Levels
Injective resistance levels start at $5.427 (daily BB upper band), then $5.504 (marked resistance zone), then a bigger air pocket up toward $6.381 and $7.346, which lines up with the June swing high.
Injective support levels sit at $4.261 first, then the weekly BB basis is near $4.365 as a secondary floor. Below that, the range drops toward $2.725-$2.650, a zone that's held since spring.
A daily close back under $4.261 would put this week's strength in doubt. A weekly close under $4.365 would be the clearer bearish signal.
These are the injective support level and injective resistance level markers that matter most for both a short-term read and a longer inj monthly forecast.
On-Chain and Tokenomics: Staking, Burns, Supply
Here's the part most quick takes on INJ skip entirely.
Total supply sits at 100,000,000 INJ, with 99.97M already circulating, per CoinMarketCap's Injective page. There's no listed max supply cap, but unlocked market cap and FDV are nearly identical at $480.85M and $480.87M. Translation: there's no meaningful unlock cliff sitting ahead of this chart.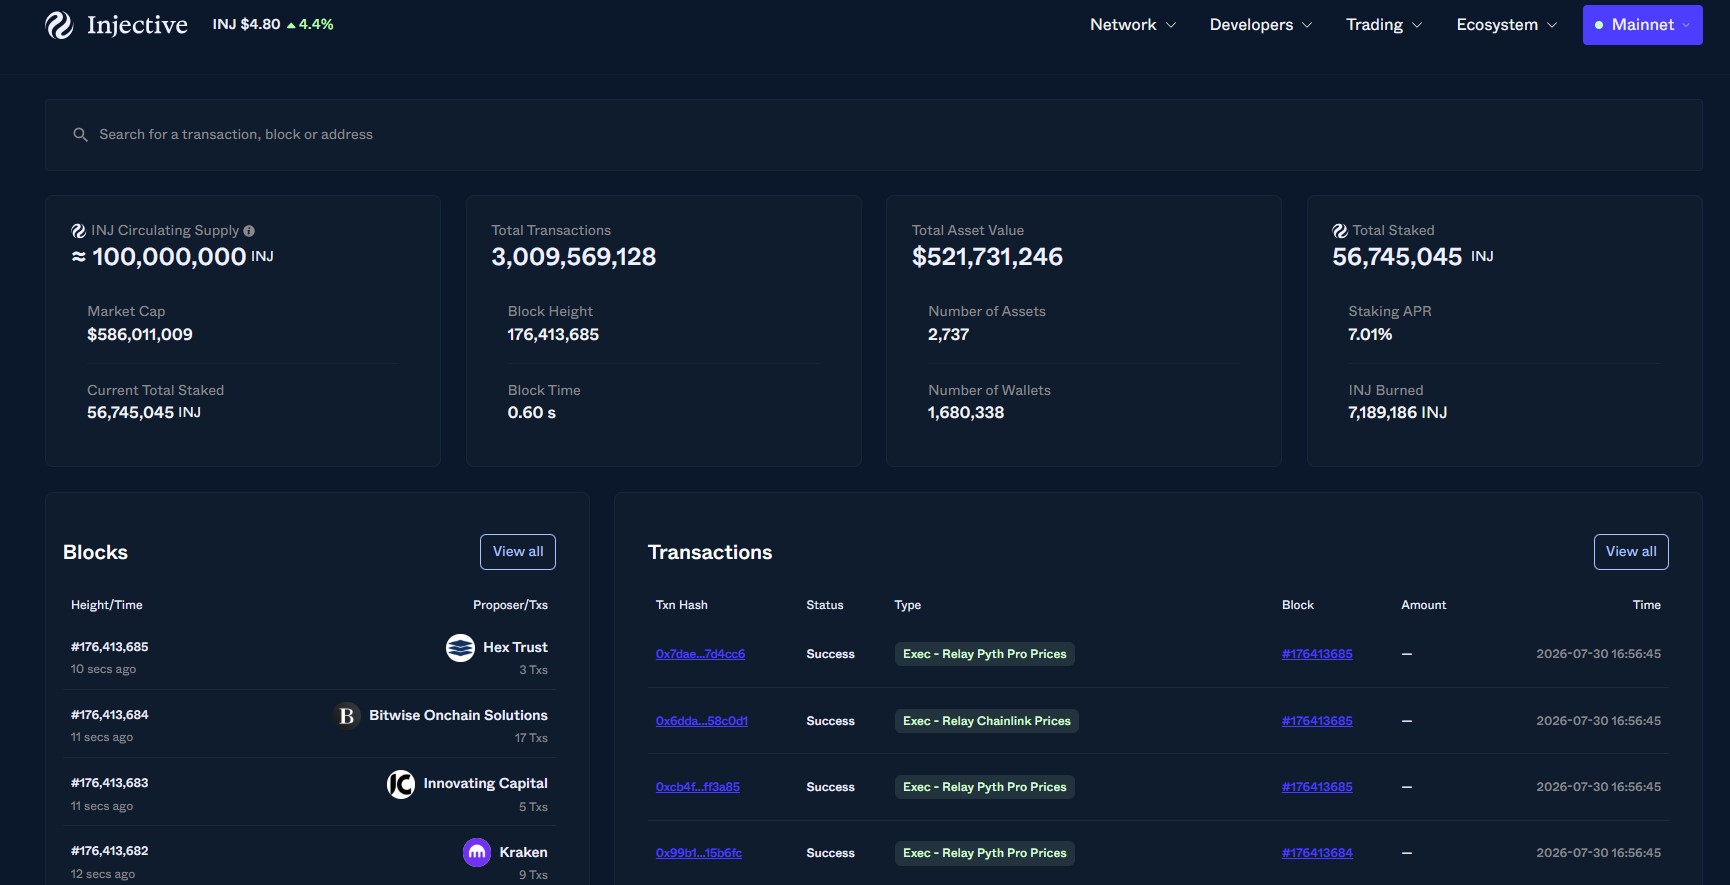
On Injective's own explorer, 56,745,045 INJ is currently staked, a 7.01% staking APR, out of a circulating base of roughly 100M. That's a little over half the supply locked into securing the network rather than sitting on exchanges.
Cumulative INJ burned sits at 7,189,186 tokens. Total wallet count is 1,680,338, and total transactions have crossed 3,009,569,128 as of the July 30, 2026 (16:56:45 UTC-based) explorer snapshot.
Total asset value tracked on-chain reads $521,731,246; block time is a fast 0.60 seconds.
Add the August buyback, another 33,000+ INJ headed for permanent removal, and you get a supply picture that's actively shrinking rather than growing into new unlocks.
Where INJ Is Actually Trading
Futures volume is spread across several venues rather than concentrated on one. Coinglass data shows Binance leading at $33.94M, LBank at $20.35M, BingX at $14.05M, WhiteBIT at $11.60M, MEXC at $10.13M, Bybit at $9.51M, OKX at $6.75M, and Bitget at $4.85M, with smaller slices on Gate, KuCoin, and Bitunix.
That total, roughly $115M-$120M across venues, sits well under INJ's $480M market cap. Unlike a lot of altcoins pumping on pure leverage right now, this ratio doesn't scream squeeze.
24-hour liquidations back that up: $109.51K total, $73.55K from shorts against $35.96K from longs. In the most recent hour, it was $100.11K in shorts against $0 in longs.
Shorts are getting squeezed here. But it's a modest squeeze, not a blow-off.
Injective Price Prediction August 2026: Bull, Base, Bear
Treat this table as a directional read for an $INJ forecast in 2026, not a guarantee. Probabilities reflect relative likelihood given the current structure, not statistical certainty.
| Timeframe | Bull Case | Base Case | Bear Case |
|---|---|---|---|
| 24H | Clears $5.43–$5.50 and tags $6.38 as a resistance zone as momentum builds (Probability: Moderate). | Consolidates between $4.60–$5.00 while the triangle keeps compressing (Probability: High). | Fades back below $4.60 and retests $4.26 (Probability: Low). |
| 7D | A weekly close above $5.00–$5.43 confirms the channel breakout and opens a path to $6.38–$7.35 (Probability: Moderate). | Range-bound between $4.26–$5.43 while the pattern resolves (Probability: High). | A weekly close below $4.36 pushes price back toward $3.90 (Probability: Low). |
| August 2026 | Institutional pilots plus the buyback burn pull INJ toward $6.38–$7.35, a realistic Injective price target for the month (Probability: Moderate). | Chops between $4.26–$5.50, tracking broader Layer-1 sentiment (Probability: Moderate–High). | A broader market correction or stalled triangle drags INJ back toward $2.65–$3.90 (Probability: Low–Moderate). |
Invalidation for the bullish case is a daily close under $4.261. A weekly close under $4.365 would confirm a deeper pullback toward the $2.65 zone. Don't treat the bull-case numbers as a promised outcome; they're a range tied to conditions that still need to show up on the chart.
Will $INJ reach $10? Can It Reach $50?
$10 is realistic on a clean break of this triangle and channel, roughly a 2x from current levels, and it lines up with the $7.35-plus zone extending toward prior 2025 resistance bands. That's a plausible $INJ price target for 2026 if the institutional narrative keeps building.
$50 is a different question entirely. INJ's all-time high sits at $52.75, hit back on March 14, 2024, and the token is still down about 90.92% from that level. Getting back there would need a near-total re-rating of the entire Layer-1 sector, not just one or two partnership headlines.
A more grounded, objective long-term price prediction points toward the $7-$15 range as the realistic ceiling for this cycle, contingent on the trade finance pilot scaling and the buyback program continuing to shrink supply.
Risks That Could Invalidate This Forecast
A Bitcoin-led market correction tops the list, since altcoins rarely hold independent strength through a broad risk-off move.
Failed breakout risk is real too. INJ has tested this triangle resistance before and failed to hold above it.
And regulatory or macro shocks specific to August could hit sentiment regardless of what Injective's own fundamentals are doing.
Weak altcoin liquidity across the board would also cap upside even if INJ's own chart looks constructive.
Glossary
RSI (Relative Strength Index): A 0-100 momentum gauge; above 70 usually signals overbought, and below 30 signals oversold. INJ sits neutral on both timeframes right now.
Bollinger Bands: Bands plotted around a moving average that widen and narrow with volatility; price above the upper band signals extension, and price at the basis signals equilibrium.
Symmetrical Triangle: A converging pattern with falling highs and rising lows; it can resolve in either direction, though a volume-backed break above resistance is the bullish signal to watch.
Descending Channel: A downward-sloping pair of trendlines; a break above the upper line is typically read as a bullish structural shift.
FDV (Fully Diluted Valuation): What market cap would there be if every token, including any still locked, were circulating? INJ's FDV and market cap are nearly identical, meaning almost nothing is left to unlock.
Methodology
Chart levels came from the INJ/USDT daily and weekly charts on OKX via TradingView, using RSI-14 and 20-period Bollinger Bands captured intraday on July 30, 2026. Supply, market cap, and price data came from CoinMarketCap. Staking, burn, wallet, and transaction data came from Injective's own on-chain explorer. Liquidation and futures volume data came from Coinglass.
Disclaimer: This is speculative market commentary, not financial or investment advice. Crypto assets are volatile and can lose most or all of their value. Data is current as of July 30, 2026; verify live figures before trading.









.jpg)








