Internet Computer Price Prediction August 2026: 190% Rally Loading?


Internet computer price prediction August 2026 has become one of the more watched ICP topics as traders wait to see whether the coin can finally break its long consolidation range.
A sharp reversal off recent lows, followed by weeks of quiet sideways trading, has left the market asking the same question on both the daily and weekly charts.
This analysis reviews support, resistance, RSI, and the bullish and bearish scenarios for ICP using the daily and weekly timeframes, along with the network activity behind this month's renewed attention.
Internet Computer Price Today: Live Data and 24-Hour Change
ICP is trading near $2.073, down about 0.1 percent over the past 24 hours.
Futures volume sits at $39.01 million against spot volume of $7.33 million, with open interest at $65.09 million.
Market cap is $1.15 billion on a circulating and total supply of 555.23 million ICP, which carries no fixed maximum supply.
Source: Internet Computer data taken from CoinGlass; data as of July 31, 2026. Figures may vary slightly across other tracking websites.
On-Chain and Fundamental Drivers (Internet Computer)
Dfinity's network has had a record-breaking July, according to a roundup shared by BSCNews on X citing Pierre Samaties.
The update highlights Internet Computer processing 133 million transactions per day, positioning it as the second most active blockchain globally by that measure.
The same update points to the launch of an MCP beta that lets AI agents, including Anthropic's Claude, execute on-chain operations and gaming actions across the ecosystem without human intervention, working alongside X2Worldtech.
Caffeine AI has also expanded into the AWS Marketplace and the Claude MCP directory, while MULTI/DEX reportedly reached a simulated volume of $243 million within 24 hours.
Source: BSCNews on X, July 2026 update on Dfinity network activity.
Quick Take
CMP: $2.073 (-0.1% on the day)
Daily trigger: close above $2.393 opens $2.624 and then $3.219, with $4.093 for aggressive buyers
Daily failure: below $1.853 keeps $1.5 as the next support to watch
Weekly trigger: close above $2.400 opens $4.098, then $4.831 and $6.028
Weekly failure: close below $1.804 exposes $1.5 and then the $1 psychological level
Daily RSI: 40.65 | Weekly RSI: 41.48
Data as of July 31, 2026, IST
Internet Computer Technical Forecast August 2026
On the daily chart, ICP has been under pressure from a descending trendline connecting three separate rejection points, each tap producing fresh selling. That decline has dragged the price back into a support zone, a setup also covered in the trend-continuation piece.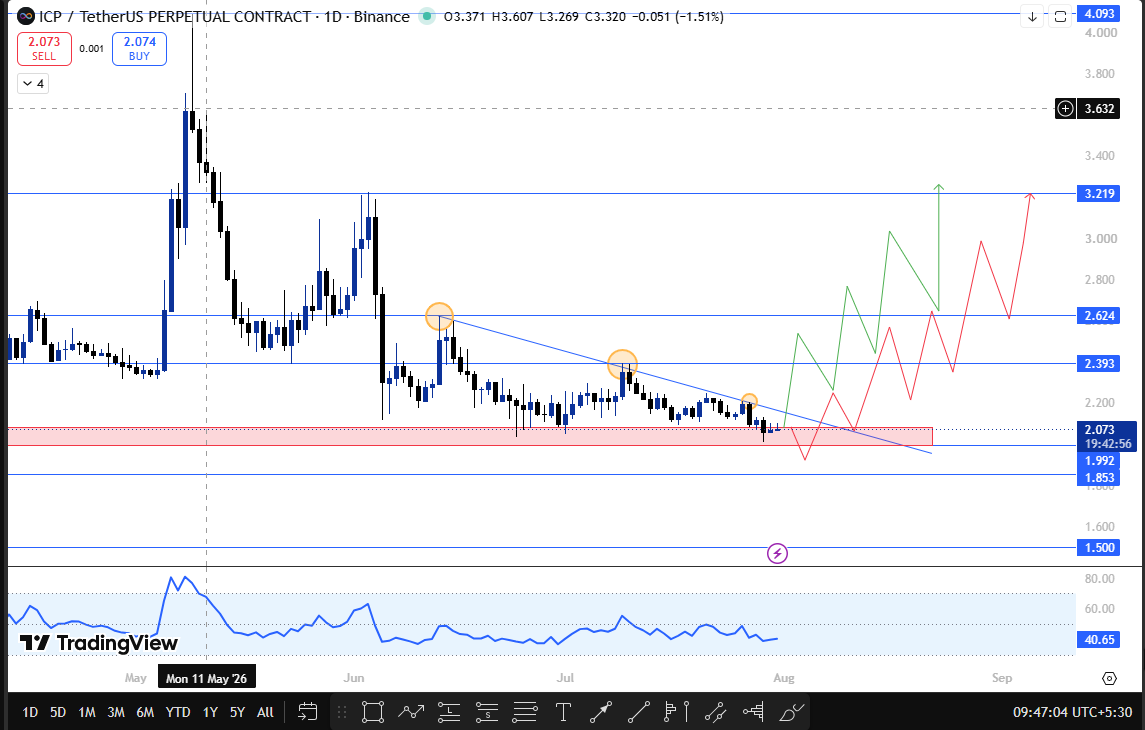
The last time ICP tested this same zone, it produced close to a nearly 100% upmove, which is why buyers are watching closely to see if history repeats.
A confirmed daily close above $2.393 would open $2.624 and then $3.219, with $4.093 as the level for more aggressive buying, a target range discussed further in the rally analysis piece.
A failure to close above $2.393 keeps the focus on the current support zone, and a deeper break below $1.853 would put the $1.5 psychological level in play as the next support to defend.
Source: Internet Computer Daily chart via TradingView.
The weekly chart shows ICP sitting inside a very strong support zone, one that has already produced an almost 100% buying move the last time the price touched it. ICP has now been consolidating inside this zone for close to six weeks.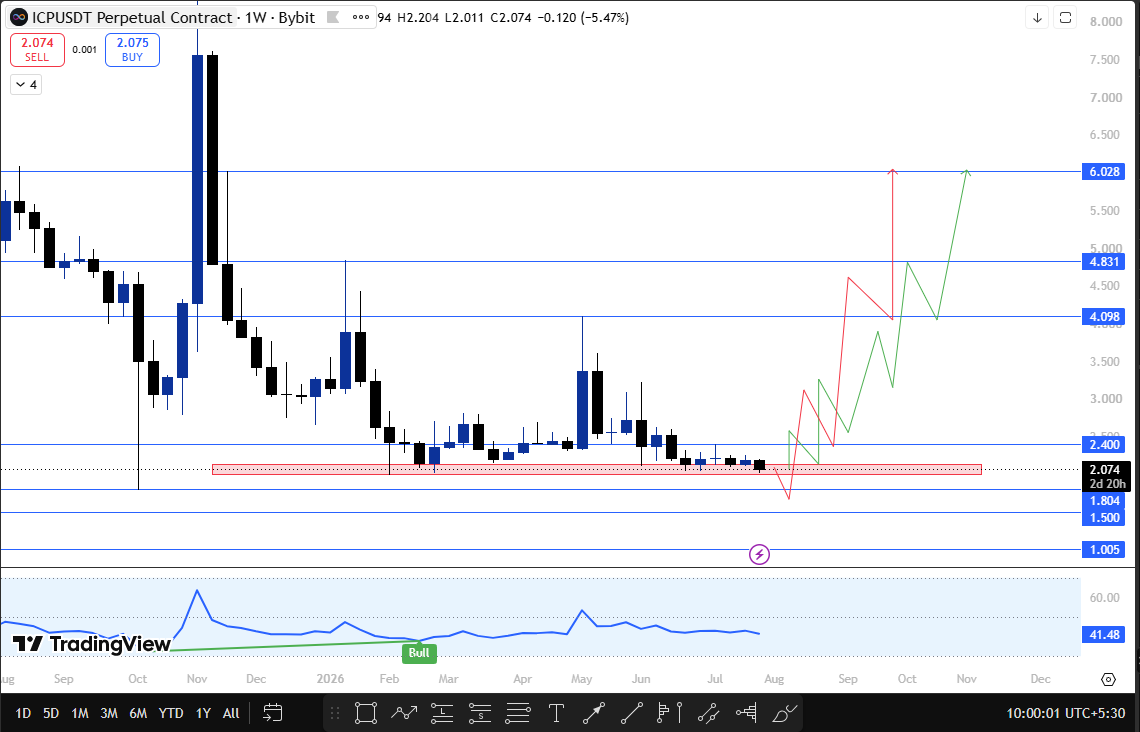
A weekly close above $2.400 would open $4.098 as the next major resistance, followed by $4.831 and $6.028 further out. A close below $1.804 would shift focus toward $1.500 and then the $1 psychological level, a pattern also touched on in the market insight piece.
Source: Internet Computer Weekly chart via TradingView.
Technical Analysis: Key Support and Resistance Levels (ICP)
Timeframe | Resistance | Support | Trigger |
Daily | $2.393, $2.624, $3.219, $4.093 | $1.853, $1.5 | Close above/below $2.393 / $1.853 |
Weekly | $2.400, $4.098, $4.831, $6.028 | $1.804, $1.5, $1 | Close above/below $2.400 / $1.804 |
ICP Price Prediction for August 2026: Bull, Base, and Bear Cases
The base case for August has ICP continuing to consolidate inside the current support zone that has held for close to six weekly candles, without a decisive break either way.
The bull case activates on a confirmed daily close above $2.393, which opens $2.624 and $3.219, with $4.093 as the more aggressive target if the weekly candle also closes above $2.400 for a run at $4.098, $4.831, and $6.028.
The bear case needs a break below $1.853 on the daily and $1.804 on the weekly, which would put $1.5 and eventually the $1 psychological level back in play.
Each scenario depends on a confirmed close on its respective timeframe, not an intraday wick.
August 2026 Catalysts That Could Move Internet Computer
The clearest fundamental tailwind heading into August is the ecosystem activity described in Dfinity's July update, particularly the MCP beta that lets AI agents operate across ICP applications and the expansion of Caffeine AI into the AWS Marketplace and Claude's MCP directory.
MULTI/DEX's reported $243 million simulated volume within 24 hours also points to growing DeFi interest on the network, though this remains a simulated figure rather than confirmed live volume.
ICP's recent price action has also been grouped alongside other Layer-1 movers, a pattern covered in the sector-wide movement piece.
What Analysts Are Forecasting (Internet Computer)
Sentiment around ICP is currently split between traders reading the support zone hold as the start of a base and those pointing to the daily RSI at 40.65 as still too soft to confirm a reversal.
Neither view has been confirmed yet, and both are waiting on the same thing: a decisive close outside the current support-to-resistance range on the higher timeframe.
Internet Computer Long-Term Outlook: 2027 to 2030
A sustained break above the weekly resistance ladder of $4.098, $4.831, and $6.028 would materially improve Internet Computer's longer-term structure. but that outcome still depends entirely on August's price action holding above the current support zone.
Similar longer-range upside scenarios for ICP have been discussed in the Upbit listing target piece, though any long-term view remains conditional on the near-term levels above holding first.
Risks That Could Invalidate This Forecast (Internet Computer)
The bullish case fails if the daily chart cannot close above $2.393 and fails more decisively if the weekly candle closes below $1.804, which would open the $1.5 and then $1 levels.
Broader risks include Bitcoin dominance shifts, macro liquidity conditions, and general crypto market volatility, any of which could override Internet Computer's own technical structure regardless of where the trendlines sit.
How to Buy and Store an Internet Computer Safely
ICP can be bought on major exchanges that support spot and futures markets, then moved to a personal wallet for storage rather than left on an exchange long-term.
Hardware wallets are generally considered the safer option for holding larger amounts, and enabling two-factor authentication on any exchange account is a basic but important precaution.
Glossary
Descending trendline: a downward-sloping line connecting a series of lower highs, used to track a prevailing downtrend
RSI (Relative Strength Index): a momentum indicator scaled 0-100, where readings below 50 suggest weaker momentum and above 50 suggest stronger momentum
Support zone: a price band where buying pressure has previously stepped in
Resistance zone: a price band where selling pressure has previously capped upside
Psychological level: a round number, such as $1.5 or $1, that often acts as a support or resistance zone simply because traders watch it closely
Invalidation level: the price point at which a forecast scenario is considered incorrect
Consolidation: a period where price trades within a defined range rather than trending strongly in either direction
Disclaimer: This article is for informational purposes only and does not constitute financial advice. Cryptocurrency markets are highly volatile, and all price levels discussed are based on technical chart analysis, not a guarantee of future performance. Readers should conduct their own research before making any investment decisions.











.jpg)






