Cardano Price Prediction: 6 Years Of Staking Is Big Move Coming Next?


By Rahul Rathore | Published: July 31, 2026 | Updated: July 31, 2026
Key Takeaways
-
Cardano price prediction today centers on a rising wedge near $0.1689.
-
A breakout above $0.1764 could open the door toward $0.1836, $0.1900, and $0.2000.
-
A breakdown below $0.1554 may drag price toward $0.1486 and $0.1381.
-
RSI sits at 59, suggesting a pullback within a buying zone.
-
The network marks 6 years since Shelley introduced non-custodial staking.
-
ETF AUM stands at $48.1 million, up $1.8 million in 24 hours.
Cardano price prediction chatter is picking up as the network's six-year staking anniversary lines up with a tightening chart setup heading into the first week of August 2026.
Shelley, the upgrade that brought non-custodial staking and delegation without any lock-up requirements, went live six years ago, according to a post from Cardanians on X.
That milestone now overlaps with a structure traders are watching closely for the next directional break, making this one of the more talked-about Cardano news updates today.
What Is Cardano's Price Today?
ADA is changing hands around $0.1689 at press time, up 4.09% over the past 24 hours, keeping Cardano price today in sharp focus.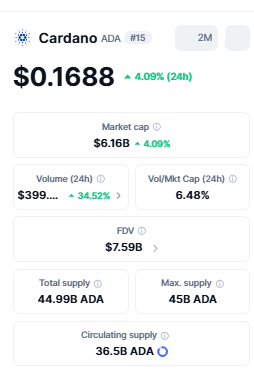
Market cap sits near $6.16 billion, with 24-hour volume of roughly $399 million, a volume-to-market-cap ratio of 6.48%. FDV stands at $7.59 billion against a circulating supply of 36.5 billion and a max supply of 45 billion.
| Metric | Value |
| Price | $0.1689 |
| 24h Change | +4.09% |
| Market Cap | $6.16B |
| 24h Volume | $399M |
| FDV | $7.59B |
| Circulating Supply | 36.5B ADA |
| Max Supply | 45B ADA |
Source: Market data captured on the TradingView and CoinMarketCap dashboards, 10:15 AM IST, July 31, 2026.
Quick Take: Cardano price prediction today points to consolidation inside a rising wedge near $0.1689. A close above $0.1764 favors continuation toward $0.1900, while a breakdown under $0.1554 shifts focus lower.
RSI at 59 keeps the setup cautiously bullish for now.
Is A Rising Wedge Forming On The 4-Hour Chart?
On the 4-hour ADA/USDT chart on Binance via TradingView, the setup shows a rising wedge after price gave a fakeout below $0.1554, a brief dip that failed to hold and quickly reversed.
Since then, both edges of the wedge have been respected closely, with higher lows stacking against a flattening upper boundary near $0.1750. 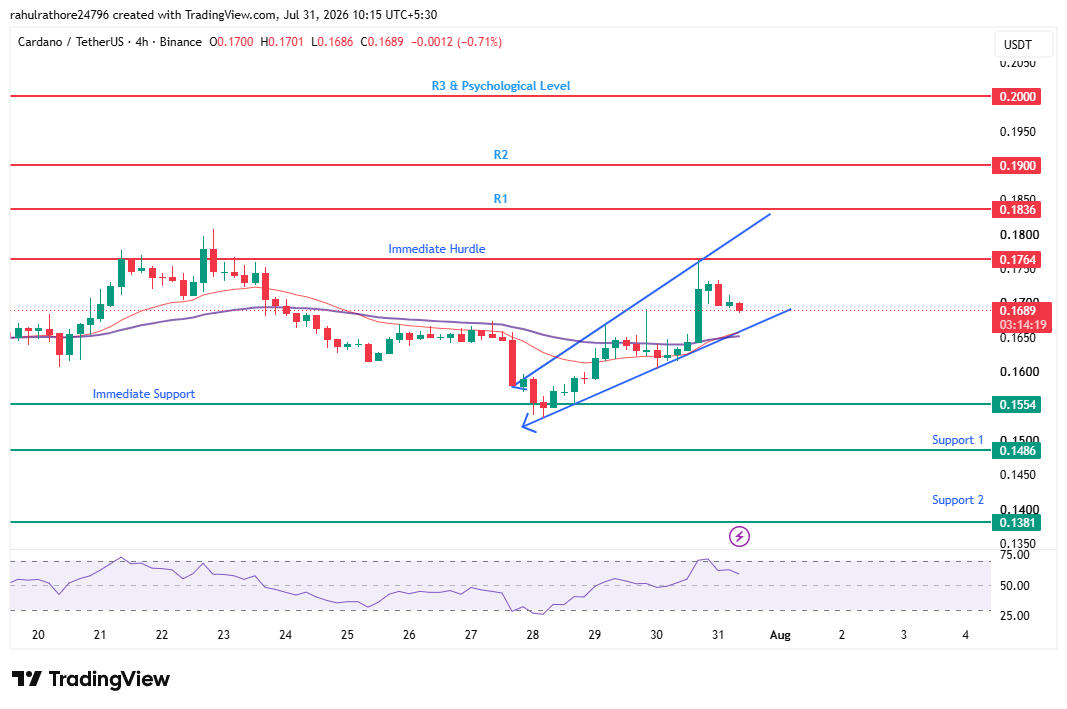
This structure often reflects a market coiling rather than trending, and the eventual break tends to carry more weight than the pattern itself.
The 20-period and 50-period EMAs, short and medium-term trend indicators that smooth out price noise, are bunched tightly together on the 4-hour timeframe, typically signaling indecision.
A bullish crossover paired with a confirmed close above $0.1764 would strengthen the case for continuation toward $0.1836. A bearish crossover alongside a wedge breakdown would tilt the setup lower instead.
The RSI, a momentum gauge on a 0 to 100 scale, currently reads 59. That places the token in a mild pullback after recently re-entering the buying zone, rather than showing exhaustion at the top of a rally.
An RSI in the high 50s generally leaves room for further upside before momentum itself becomes a constraint, which lines up with the still-open bull case in this Cardano price prediction outlook.
How Much Was Liquidated Recently?
Leveraged positions saw notable liquidations across multiple windows, per CoinGlass data.
| Timeframe | Total Rekt | Long | Short |
| 1h | $10.86K | $10.86K | $0 |
| 4h | $47.13K | $19.94K | $27.19K |
| 12h | $166.87K | $133.88K | $32.99K |
| 24h | $700.85K | $195.17K | $505.69K |
Source: CoinGlass liquidation dashboard, figures pulled during the July 31, 2026, trading session.
Longer windows show short positions absorbing most of the damage over 24 hours, while shorter windows lean the other way, pointing to a choppy, two-sided market.
Is ETF Demand Rising?
ADA-linked ETF AUM stood at $48.1 million, up $1.8 million in 24 hours, per Blockworks data shared via a post on X. 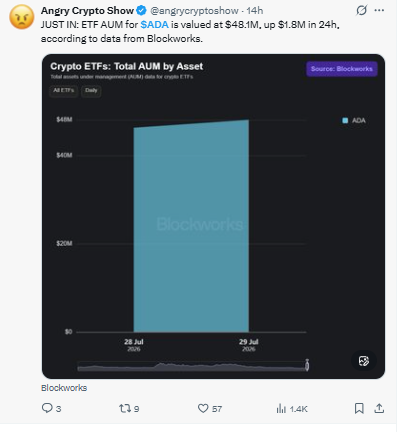
The figure is small next to the multi-billion-dollar market cap, but the uptick adds a secondary demand signal worth tracking in the broader Cardano price outlook.
Cardano Price Prediction: Bull, Base, And Bear Case
| Scenario | Trigger | Target Levels |
| Bull | 4H close above $0.1764 with bullish EMA crossover | $0.1836, $0.1900, $0.2000 |
| Base | Price holds inside $0.1554 to $0.1764 range | Sideways consolidation continues |
| Bear | 4H close below $0.1554 and under both EMAs | $0.1486, $0.1381 |
Methodology note: These levels come from the 4-hour wedge structure on TradingView, cross-checked against CoinGlass liquidation clusters.
Each scenario is invalidated only by a confirmed 4-hour candle close beyond the stated trigger, not an intraday wick.
Does The 6-Year Staking Anniversary Change The Outlook?
The staking model introduced at Shelley remains one of the network's core selling points heading into this milestone.
The anniversary isn't a technical catalyst on its own, but it reinforces the staking-driven security narrative right as the chart sits at a decision point.
Expert Opinion
As per a CoinGabbar market analyst, this Cardano price prediction setup hinges on the wedge holding its lower boundary while the EMAs stay compressed.
A sideways EMA structure this close to price often precedes a volatility expansion, and the direction of that break will likely decide whether targets shift toward $0.1900 or back to $0.1486.
ETF AUM growth, though modest, is worth folding into any medium-term outlook.
Glossary Of Key Terms
-
RSI: Momentum indicator on a 0-100 scale flagging overbought or oversold conditions.
-
EMA: A trend-tracking average weighing recent price data more heavily than older data.
-
Rising Wedge: Converging upward-sloping trendlines, often signaling a pause before a breakout or breakdown.
-
Fakeout: A brief move beyond support or resistance that quickly reverses, trapping breakout traders.
-
FDV: The theoretical market cap if a token's entire max supply were in circulation.
-
Liquidation: Forced closure of a leveraged position when losses erode margin below maintenance level.
-
ETF AUM: Total dollar value of assets held within an ETF tracking a given token.
-
Flip Zone: A price level that has switched roles between support and resistance over time.
Disclaimer: This article is for informational purposes only and does not constitute financial advice. CoinGabbar has no sponsorship or affiliate relationship tied to this coverage. Cryptocurrency markets are highly volatile, and prices can change rapidly. Please do your own research and consult a qualified financial advisor before making any investment decisions.











.jpg)






