XRP Triangle Pattern: Is the 10-Year Setup Pointing to $13?


Updated on: July 20, 2026
Change Log: Added triangle pattern analysis, ETF flow context, moving averages, support and resistance, bull/base/bear scenarios, and analyst comparison.
XRP Eyes $13 as Macro Triangle Nears Its Breaking Point!
The XRP triangle pattern is approaching one of its most important breakout zones in more than 10 years.
Traders following XRP analysis today are watching whether the long-term structure can finally resolve higher or fail below key support.
This setup also feeds into the broader XRP price prediction 2026 outlook, as the next few monthly candles could decide whether it remains bullish or bearish for the remainder of the cycle.
The latest 2-month candle closed near $1.12, down roughly 18% from the open. Current trading volume remains closely watched because rising volume alongside a breakout would provide stronger confirmation than price action alone.
What Is the XRP Triangle Pattern and Why Does It Matter?
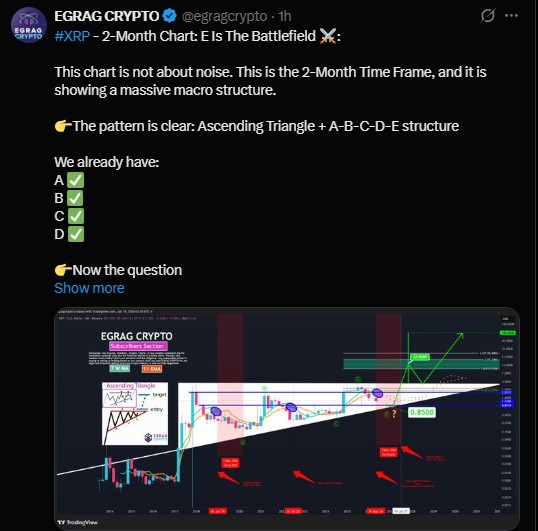
XRP's 2-month chart shows a clear A-B-C-D-E Elliott Wave structure forming inside a rising triangle. Points A through D have already played out across several years.
The market is now at point E, the last compression zone before the triangle resolves. Analysts at EGRAG CRYPTO call this the battlefield.
Immediate support remains at $0.85, while major resistance sits between $2.00 and $2.10 before the larger breakout targets become active.
A 2-month close below this level would break the entire macro structure and invalidate the setup.
The key floor sits at $0.8500. These are currently the most important XRP support and resistance levels.
What Are the XRP Price Targets If the Breakout Is Confirmed?
No targets are active yet. the must clear three conditions before any Fibonacci levels become relevant.
First, hold the rising macro support. Second, reclaim the 7-week MA and 11 EMA. Third, break and close above the resistance zone between $2.00 and $2.10.
The model combines its moving averages, Fibonacci extensions, RSI momentum, and long-term market structure rather than relying on a single indicator.
-
$9.52 at the 1.618 Fibonacci extension
-
$13.00 as the primary macro target
-
$17.23 at the 2.0 Fibonacci extension
-
$26.30 at the 2.272 extension
-
$100 as the extreme cycle scenario
The measured move from the 10-year triangle pattern also supports the broader macro projection, although confirmation above resistance remains essential before these targets become active.
The $13 level is the main focus after a confirmed breakout. The $100 scenario is the upper-end extension that requires full cycle momentum.
What Does XRP 2-Month RSI Show About Macro Momentum?
The 2-month RSI chart maps three full market cycles. Each one follows the same rhythm: major spike, cooldown, deep reset, then expansion.
$XRP's RSI is currently sitting near 46.50, just below the critical 50 level.
Key RSI levels to watch:
-
43.66 is the deeper reset support if the price weakens further
-
50.00 divides the recovery momentum from the continued decline
-
52.85 is the zone the altcoin must reclaim for macro strength
-
80.00 is where past expansion phases have peaked
The current setup visually matches the third macro reset on the RSI chart. If RSI holds 43.66 and reclaims 52.85, the data suggests a momentum repair cycle is underway.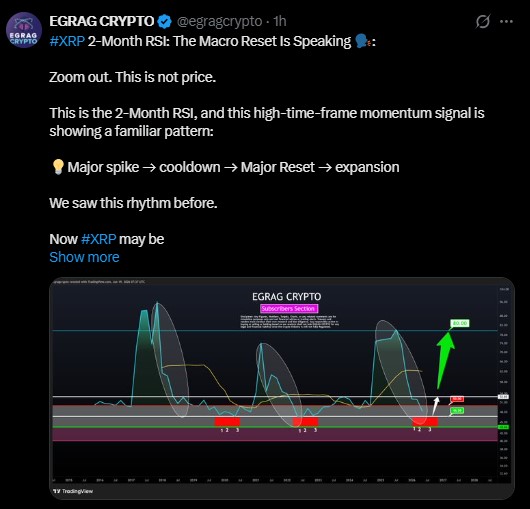
The 7-week MA and 11 EMA are the primary XRP moving averages traders are watching. A recovery above both would strengthen the bullish case, while failure could delay the breakout.
How Could $XRP ETF Flows Affect the Triangle Pattern?
Institutional demand remains another factor alongside technical analysis.
Weekly ETF flow trends are becoming an important sentiment indicator, as sustained inflows generally support stronger buying pressure while persistent outflows can delay breakouts despite bullish chart structures.
How Long Could It Take $XRP to Reach the $13 Target?
Analyst | Target | View |
Standard Chartered | ~$2.80 | Base Case |
EGRAG CRYPTO | $7-$10 | Cycle Target |
Current Triangle Model | $13 | Breakout Target |
Each candle on this chart covers two months of price history. This is not a short-term setup.
Ripple has historically printed a macro bottom near every 425 days, or roughly 7 bars on the 2-mnth timeframe. The current window points to the next 2-mnth candle as the possible final bottom zone.
If the structure confirms, the move toward $13 and beyond could develop through the remainder of 2026 and into 2027, based on the chart timeline shown.
What Could Stop $XRP From Following This Macro Setup?
The setup breaks if the altcoin closes a 2-month candle below $0.8500. A confirmed RSI drop and hold under 43.66 would also point to a deeper macro reset.
The $2.00 to $2.10 resistance zone has already rejected the price more than once. A failed breakout attempt there could push the entire timeline back by several month.
Scenario | Probability | $XRP Target | Invalidation |
Bull | 30% | $9.5-$13 | Confirmed breakout above $2.10 |
Base | 50% | $2.8-$5 | Range holds |
Bear | 20% | Below $0.85 | Triangle fails |
For traders searching for XRP price prediction today or price prediction this week, the macro triangle remains incomplete. Until resistance breaks, XRP stays in a confirmation phase rather than a confirmed bull market.
Whether it will go up tomorrow depends largely on short-term momentum, but the larger structure is designed for investors with a multi-month horizon. Those asking if $XRP is a good buy right now should focus on confirmation above resistance rather than trying to predict the exact breakout candle.
Expert View
The 10-year XRP triangle pattern is one of the most significant long-term technical structures on the chart, but it remains unconfirmed until price decisively breaks above the $2.00–$2.10 resistance zone.
Momentum indicators, including RSI, moving averages, and Fibonacci extensions, suggest the market is approaching a critical inflection point rather than guaranteeing an immediate rally.
Investors should also monitor XRP ETF flows, trading volume, and broader market sentiment, as these factors could influence the strength of any breakout.
While the $13 target is technically achievable under a bullish scenario, confirmation and sustained buying pressure are essential before higher price projections become credible.
Disclaimer: This article is for informational purposes only. It does not constitute financial advice, investment guidance, or a solicitation to buy or sell any asset. Cryptocurrency markets are highly volatile and carry a significant risk of loss. Always conduct your own research and consult a licensed financial professional before making any investment decisions.




















