XRP Support and Resistance Levels: Can XRP Reach $5 in 2026?

XRP Price Prediction: Ripple Holds $1.06 as Bulls Watch for Next Move
XRP is trading near $1.05 after an 8.22% weekly drop, putting the latest XRP support and resistance levels under close scrutiny.
The token is sitting on a key support zone backed by more than 830 million tokens in on-chain volume, while traders are watching whether buyers can defend this area or whether the XRP price target 2026 outlook will shift toward deeper downside levels.
The latest XRP support and resistance levels show $1.06 as the immediate decision zone, while $1.67 and $1.81 remain key resistance levels that could determine the next major move.
What happens at this level could set the tone for the rest of 2026.
For traders looking at the XRP price prediction 2026 outlook, the immediate question is whether the current support zone can hold. A sustained recovery could bring $1.67 and $1.81 into focus as the next major resistance levels, while a breakdown could expose $0.80 and $0.62. This makes the current XRP forecast 2026 setup a key test of whether $XRP is turning bullish or bearish.
XRP Support and Resistance Levels: What Traders Need to Know
The most important level right now is the battle playing out at the $1.06 support level. On-chain data from the UTXO Realized Price Distribution (URPD) confirms this is one of the heaviest volume nodes in XRP's recent price history.
CoinGlass data shows open interest sitting at $2.38 billion, up 2.19% in 24 hours, meaning futures traders are still active and adding positions even as price pulls back.
Spot volume over 24 hours is $554 million, with a market cap at $65.76 billion, and a circulating supply of 62.24 billion tokens.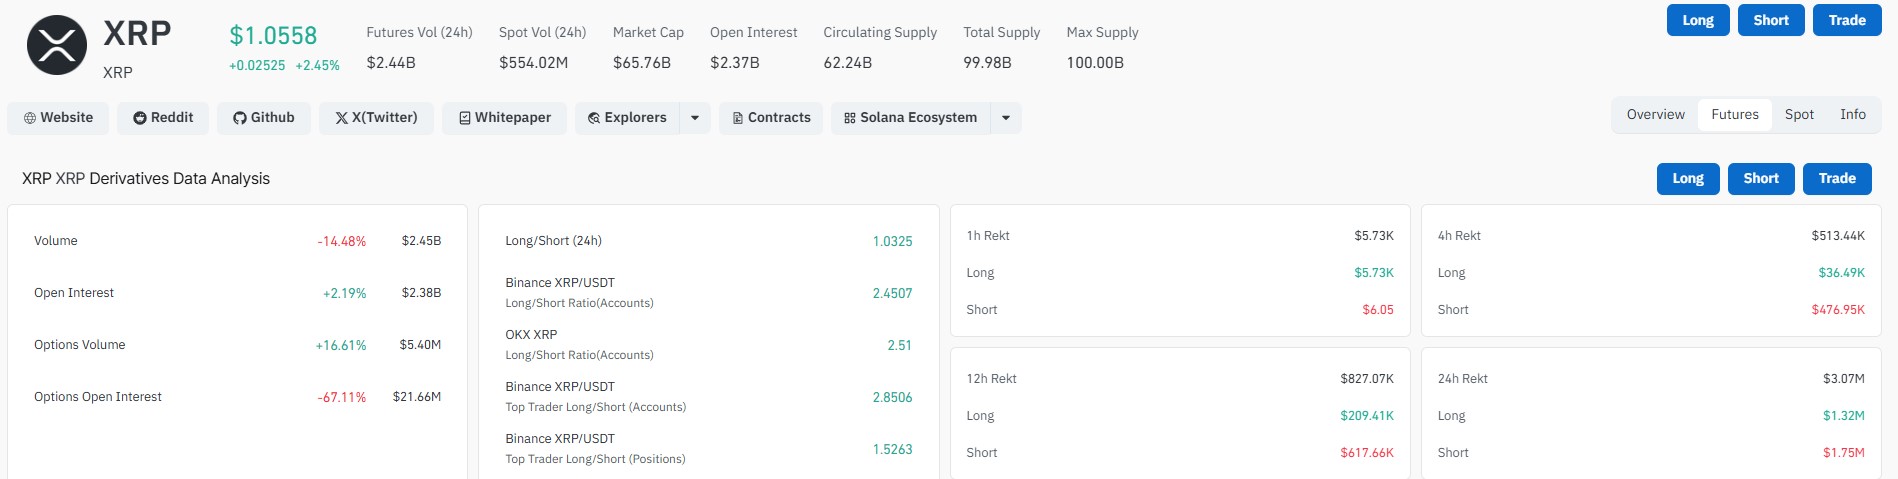
These figures also matter for the future price outlook because trading volume and market capitalization can influence how easily the asset moves through major resistance zones. If volume expands alongside a breakout, the XRP market cap potential could improve as new capital enters the market. However, weak volume during a rally could make any breakout less reliable.
$XRP Price Forecast 2026: Key Support and Resistance Levels
The XRP price forecast for 2026 depends heavily on whether bulls can defend the $1.06 zone and push back above the $1.67 and $1.81 resistance levels.
If that happens, analysts tracking Fibonacci extension targets from the cycle low near $0.85 are watching:
-
$5.11 (1.272 Fibonacci extension)
-
$5.40 (secondary Fibonacci cluster)
-
$6.73 (1.414 extension)
-
$7.87 (1.618 extension)
-
$9.00 (projected cycle high zone)
These $XRP Fibonacci levels represent technical projections rather than guaranteed price targets. For the $XRP price target 2026 outlook, the first confirmation would come from reclaiming the $1.67 and $1.81 resistance zones. A stronger move above those levels could improve the bullish case, while failure to hold $1.06 would weaken the setup.
Analyst Javon Marks has publicly stated that the altcoin has another +1,300% upside potential from its lows. He pointed out that most of the market missed the run from $0.50 to over $3.30, and says the altcoin market is now entering what he describes as some of its "rarest and most dominant states."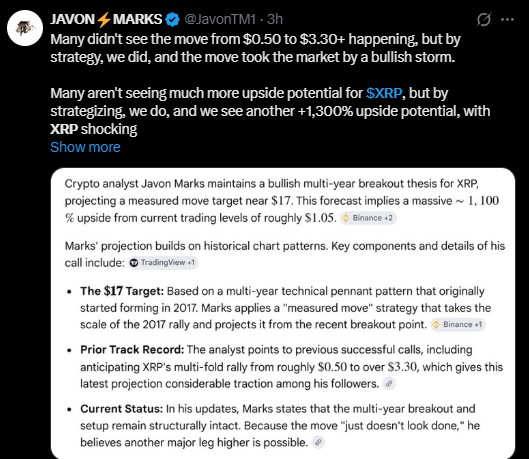
$XRP Support Levels: Where Could Buyers Step In?
On-chain URPD data outlines exactly where large groups of buyers entered the market. These are the levels where price tends to find real buying demand:
-
$1.06 — Over 830 million tokens transacted (current test zone)
-
$0.80 — 923 million tokens transacted (first major lower support)
-
$0.62 — 1.16 billion tokens transacted (deep support zone)
-
$0.51 — 1.06 billion tokens transacted (near cycle bottom territory)
The more that changed hands at a price level, the more meaningful that level tends to be as future support or resistance.
These support and resistance levels also help define the short-term $XRP price prediction today and $XRP price prediction this week. If buyers defend $1.06, the market could attempt another recovery toward $1.67 and $1.81. If that support fails, traders may turn their attention toward $0.80 and $0.62. This is why the current XRP bullish or bearish debate is largely centered on the reaction around these zones.
What Is the Latest Ripple News Affecting $XRP Price?
The broader Ripple news landscape continues to shape the macro outlook. Key themes include regulatory developments, Ripple's On-Demand Liquidity (ODL) payment expansion, institutional adoption, and speculation around a potential ETF. The ETF approval impact could become especially important if new products attract sustained capital inflows, although no catalyst can guarantee a price increase.
None of these are confirmed catalysts, but they represent the background narrative driving retail and institutional attention toward 2026.
Options open interest dropped 67.11% to $21.66 million, which signals that options traders reduced hedging activity, possibly expecting a period of lower volatility ahead.
XRP Price News: Is This Pullback a Buying Opportunity or a Warning Sign?
The news right now is a two-sided story. Bulls see the current dip as a normal retest of prior breakout zones after a 560% move from the lows.
In the bull case, holding $1.06 and reclaiming $1.67 could strengthen the recovery setup. In the bear case, losing $1.06 could increase the probability of a move toward $0.80 and $0.62. This keeps the future price outlook highly dependent on whether buyers can defend the current support structure.
Bears point to the sharp weekly drop, declining options interest, and the risk of further breakdown if $1.06 fails to hold.
This leaves traders asking how high the token can go if the current support holds. A sustained breakout above $1.81 would improve the technical structure, while a move through higher resistance zones could eventually bring larger targets into focus. However, questions such as will it reach $5 or will it reach $10 remain dependent on future liquidity, institutional adoption, market capitalization growth, and broader crypto conditions.
What makes this moment notable is the convergence of multiple data points at the same level: on-chain volume concentration, horizontal chart support near $1.00, and derivatives positioning all pointing to $1.00 to $1.06 as the decision zone.
$XRP Price Prediction Summary: Key Levels to Watch in 2026
The altcoin is at a technically important moment.
For anyone asking whether $XRP is bullish or bearish, the answer remains conditional. The asset is currently at a major technical decision point, with $1.06 acting as immediate support and $1.67 to $1.81 forming the first major resistance zone.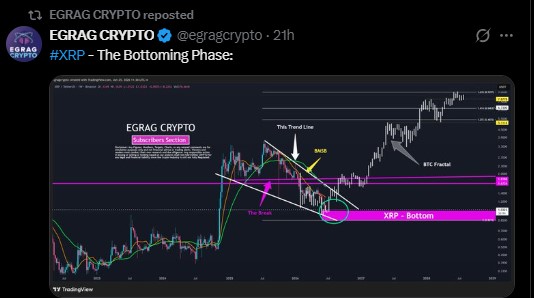
Holding here and reclaiming $1.67 keeps the door open toward $5.11, $6.73, and higher targets through 2026.
Losing $1.06 on a weekly close shifts focus to $0.80, then $0.62. The derivatives data remains long-heavy, which means the next sharp move in either direction could be amplified by liquidation pressure.
XRP Price Target 2026: Bull, Base and Bear Scenarios
The XRP price target 2026 outlook can be divided into three broad scenarios. The bear case focuses on a breakdown below $1.06, weaker trading volume, and continued pressure across the wider crypto market. The base case assumes $XRP holds major support and gradually reclaims resistance as institutional adoption and ETF-related demand improve. The bull case requires a sustained breakout above $1.81, stronger trading volume, improving market liquidity, and a broader risk-on environment.
| Scenario | 2026 Target | Probability | Key Assumption | Invalidation |
|---|---|---|---|---|
| Bear Case | $0.62–$0.80 | 25% | $1.06 support fails and market weakness continues | Reclaim above $1.81 |
| Base Case | $1.67–$3.00 | 50% | Support holds and resistance breaks gradually | Weekly close below $0.80 |
| Bull Case | $5.00–$10.00 | 25% | Strong institutional demand and major breakout | Sustained breakdown below $1.06 |
These probabilities are scenario estimates rather than guaranteed outcomes. The biggest confirmation signal for the bullish case would be a sustained breakout above $1.81 with stronger volume.
$XRP Price Forecast 2026: Analyst Targets Compared
Analyst forecasts remain divided because the future price depends on both technical conditions and the strength of institutional adoption. Standard Chartered has previously outlined a $2.80 target, while 21Shares has presented a scenario-based outlook with a $1.60 bear case, $2.45 base case, and $2.69 bull case. Changelly and CoinCodex also publish model-based projections that can differ significantly depending on market conditions and their underlying algorithms.
| Source | 2026 Target | View |
|---|---|---|
| Standard Chartered | $2.80 | Institutional forecast |
| 21Shares | $1.60 Bear / $2.45 Base / $2.69 Bull | Scenario-based outlook |
| Changelly | Model-based forecast | Algorithmic projection |
| CoinCodex | Model-based forecast | Algorithmic projection |
The wide gap between these forecasts shows why investors should treat price predictions as scenarios rather than fixed outcomes. Technical levels, ETF flows, institutional adoption, and broader market conditions can all change the final result.
XRP Price Prediction 2026: Was Our Last Prediction Right?
The previous outlook focused on the $1.06 support zone and identified $1.67 and $1.81 as key resistance levels. Since then, the market has continued to trade around the lower support area, showing that the immediate support thesis remains relevant. However, the projected upside targets have not yet been confirmed because the token has not delivered a sustained breakout above the major resistance levels.
This accuracy log will be updated with each weekly refresh. Future updates will compare the previous support, resistance, and price targets with actual market performance, helping readers track which forecasts were accurate and where the market moved differently from expectations.
XRP Price Prediction 2026 Monthly Targets
The XRP price prediction provides a scenario-based range rather than a guaranteed price prediction. These estimates should be updated during the monthly refresh based on support and resistance levels, RSI, moving averages, trading volume, ETF flows, and broader market conditions.
| Month | Low | Average | High |
|---|---|---|---|
| January 2026 | $1.20 | $1.60 | $2.00 |
| February 2026 | $1.10 | $1.50 | $2.10 |
| March 2026 | $1.00 | $1.45 | $2.20 |
| April 2026 | $0.90 | $1.35 | $2.30 |
| May 2026 | $0.80 | $1.20 | $2.00 |
| June 2026 | $0.80 | $1.15 | $1.80 |
| July 2026 | $0.80 | $1.40 | $2.20 |
| August 2026 | $0.90 | $1.60 | $2.80 |
| September 2026 | $1.00 | $1.80 | $3.20 |
| October 2026 | $1.10 | $2.00 | $4.00 |
| November 2026 | $1.20 | $2.30 | $5.00 |
| December 2026 | $1.30 | $2.60 | $6.00 |
XRP Institutional Adoption and ETF Approval Impact
Institutional adoption remains one of the most important factors for the long-term price outlook.
Greater participation from financial institutions, payment providers, and investment products could increase demand and improve liquidity. The XRP ETF approval impact is another factor traders are watching because sustained ETF inflows could provide a new source of market demand.
However, institutional participation alone does not guarantee higher prices, particularly if broader crypto sentiment remains weak.
XRP Price Prediction 2030: What Could Drive Long-Term Growth?
The XRP price prediction 2030 outlook depends on factors that extend beyond the current 2026 support and resistance structure.
Long-term adoption of blockchain-based payments, institutional use, regulatory clarity, and growth in the broader digital asset market could influence future demand.
However, any long-term forecast should be treated cautiously because technological competition, regulation, stablecoins, and changing market conditions could significantly affect future price performance.
Is XRP a Good Long Term Investment?
Whether XRP is a good long term investment depends on an investor's risk tolerance, time horizon, and view of the digital asset market. The token has an established ecosystem and a strong presence in the crypto market, but it also faces significant volatility and regulatory and competitive risks.
Investors should evaluate the asset's market capitalization, adoption, trading volume, support and resistance levels, and broader market conditions before making any decision.
Financial Risk Disclaimer: This article is for informational and educational purposes only and does not constitute financial, investment, or trading advice. Cryptocurrency markets are highly volatile and speculative. Always conduct your own research and consult a licensed financial advisor before making investment decisions.

















